
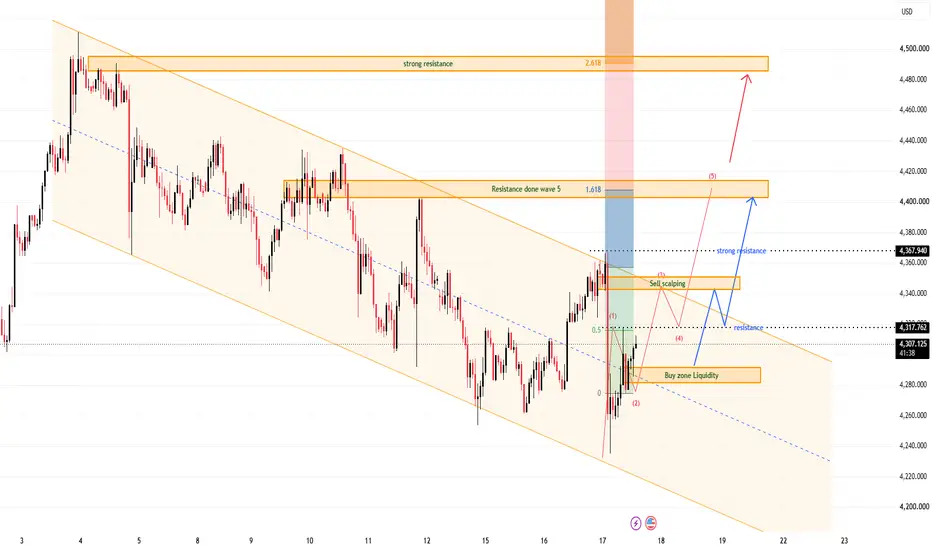
Gold is showing a bullish recovery after reacting strongly from the lower liquidity area. From Kelly’s view, the chart suggests that XAUUSD may be forming a new upside Elliott Wave structure after breaking out from the lower side of the previous bearish channel.
The key idea is simple: if gold continues to hold above the Buy zone liquidity, the recovery structure can continue toward the next resistance levels.
⟡ Market structure
Gold is currently trading around 4,310–4,318, after bouncing from the Buy zone liquidity near 4,275–4,290. This reaction shows that buyers are trying to defend the lower support area and build a new bullish base.
The first resistance to watch is around 4,340–4,355, marked as the short-term sell scalping area. If gold breaks above this zone, the next important level is the strong resistance near 4,367.
A clean move above 4,367 would strengthen the bullish structure and open the way toward the 4,405–4,415 Resistance done wave 5 zone. If momentum continues, the larger upside target remains near 4,485–4,500.
➤ Key levels
◌ Current price area: 4,310–4,318
◌ Buy zone liquidity: 4,275–4,290
◌ Short-term resistance: 4,340–4,355
◌ Strong resistance: 4,367
◌ Main wave 5 target: 4,405–4,415
◌ Extended bullish target: 4,485–4,500
◌ Bullish invalidation: below 4,255
⌁ Elliott Wave view
The chart shows a possible bullish Elliott Wave recovery.
Wave (1) may have started from the lower liquidity area and pushed price toward 4,317.
Wave (2) may have completed after the retest near 4,275–4,290.
If this buy zone holds, wave (3) may continue toward 4,340–4,355 and 4,367.
Wave (4) could create a short pullback after testing resistance.
Wave (5) may then extend toward 4,405–4,415.
If buyers remain strong above that area, gold may later attempt the larger resistance zone around 4,485–4,500.
▸ Trading scenario
Preferred bullish scenario
Entry: Buy around 4,275–4,290 if price gives bullish confirmation from the liquidity zone
Stop Loss: Below 4,255
Take Profit 1: 4,340–4,355
Take Profit 2: 4,367
Take Profit 3: 4,405–4,415
Take Profit 4: 4,485–4,500
Alternative entry
If gold breaks above 4,340–4,355 and retests this area as support, buyers may look for continuation toward 4,367 and 4,405–4,415.
◌ Invalidation
The bullish view becomes weaker if gold breaks below 4,255 and fails to reclaim the buy liquidity zone. In that case, the recovery structure may fail and price could return to the lower bearish channel.
⌁ Kelly’s view
Kelly’s main view is bullish while gold holds above 4,275–4,290. The market is showing a strong reaction from the lower liquidity area, and the current pullback may only be preparation for the next upside wave.
If buyers defend the buy zone and price breaks above 4,340–4,355, gold may continue toward 4,367, then 4,405–4,415. The larger bullish target remains near 4,485–4,500 if momentum expands.
Do you think gold will break above 4,367 first, or retest the buy zone once more before the next rally?
The key idea is simple: if gold continues to hold above the Buy zone liquidity, the recovery structure can continue toward the next resistance levels.
⟡ Market structure
Gold is currently trading around 4,310–4,318, after bouncing from the Buy zone liquidity near 4,275–4,290. This reaction shows that buyers are trying to defend the lower support area and build a new bullish base.
The first resistance to watch is around 4,340–4,355, marked as the short-term sell scalping area. If gold breaks above this zone, the next important level is the strong resistance near 4,367.
A clean move above 4,367 would strengthen the bullish structure and open the way toward the 4,405–4,415 Resistance done wave 5 zone. If momentum continues, the larger upside target remains near 4,485–4,500.
➤ Key levels
◌ Current price area: 4,310–4,318
◌ Buy zone liquidity: 4,275–4,290
◌ Short-term resistance: 4,340–4,355
◌ Strong resistance: 4,367
◌ Main wave 5 target: 4,405–4,415
◌ Extended bullish target: 4,485–4,500
◌ Bullish invalidation: below 4,255
⌁ Elliott Wave view
The chart shows a possible bullish Elliott Wave recovery.
Wave (1) may have started from the lower liquidity area and pushed price toward 4,317.
Wave (2) may have completed after the retest near 4,275–4,290.
If this buy zone holds, wave (3) may continue toward 4,340–4,355 and 4,367.
Wave (4) could create a short pullback after testing resistance.
Wave (5) may then extend toward 4,405–4,415.
If buyers remain strong above that area, gold may later attempt the larger resistance zone around 4,485–4,500.
▸ Trading scenario
Preferred bullish scenario
Entry: Buy around 4,275–4,290 if price gives bullish confirmation from the liquidity zone
Stop Loss: Below 4,255
Take Profit 1: 4,340–4,355
Take Profit 2: 4,367
Take Profit 3: 4,405–4,415
Take Profit 4: 4,485–4,500
Alternative entry
If gold breaks above 4,340–4,355 and retests this area as support, buyers may look for continuation toward 4,367 and 4,405–4,415.
◌ Invalidation
The bullish view becomes weaker if gold breaks below 4,255 and fails to reclaim the buy liquidity zone. In that case, the recovery structure may fail and price could return to the lower bearish channel.
⌁ Kelly’s view
Kelly’s main view is bullish while gold holds above 4,275–4,290. The market is showing a strong reaction from the lower liquidity area, and the current pullback may only be preparation for the next upside wave.
If buyers defend the buy zone and price breaks above 4,340–4,355, gold may continue toward 4,367, then 4,405–4,415. The larger bullish target remains near 4,485–4,500 if momentum expands.
Do you think gold will break above 4,367 first, or retest the buy zone once more before the next rally?
Trade active
The scenario played out exactly as expected.
📌 New analysis published daily
🔔 Follow this profile for real-time updates
⚠️ This is personal analysis, not financial advice
Daily GOLD and Forex updates: t.me/+_8wydjUbci5hMzJl
🔔 Follow this profile for real-time updates
⚠️ This is personal analysis, not financial advice
Daily GOLD and Forex updates: t.me/+_8wydjUbci5hMzJl
Related publications
Disclaimer
The information and publications are not meant to be, and do not constitute, financial, investment, trading, or other types of advice or recommendations supplied or endorsed by TradingView. Read more in the Terms of Use.
📌 New analysis published daily
🔔 Follow this profile for real-time updates
⚠️ This is personal analysis, not financial advice
Daily GOLD and Forex updates: t.me/+_8wydjUbci5hMzJl
🔔 Follow this profile for real-time updates
⚠️ This is personal analysis, not financial advice
Daily GOLD and Forex updates: t.me/+_8wydjUbci5hMzJl
Related publications
Disclaimer
The information and publications are not meant to be, and do not constitute, financial, investment, trading, or other types of advice or recommendations supplied or endorsed by TradingView. Read more in the Terms of Use.