
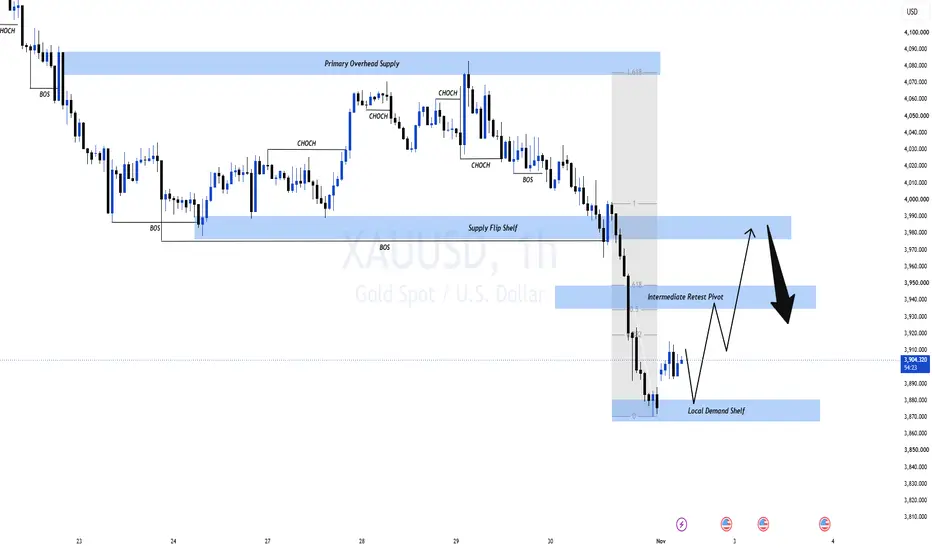
Gold is recovering from local demand after its aggressive selloff. But the next advance depends on whether buyers can defend the pullback and reclaim broken structure.
A stronger bounce is possible. A broader reversal remains unconfirmed.
MARKET OVERVIEW
Lower oil prices and buying after the selloff offer some relief.
US manufacturing and employment releases remain important catalysts this week, while expectations of further Fed tightening keep the recovery sensitive to macro developments.
H1 TECHNICAL CONTEXT
The broader structure remains bearish following successive CHoCH and BOS formations.
The latest decline broke the Supply Flip Shelf and accelerated through the Intermediate Retest Pivot before reaching local demand.
Price has now rebounded toward 3,912.
This establishes an initial demand reaction, but the chart does not yet show a confirmed bullish H1 structure shift.
The projected route allows for a demand retest before another recovery attempt toward the intermediate pivot and, conditionally, the supply shelf.
KEY ZONES
• Primary overhead supply: approximately 4,074–4,088.
• Supply Flip Shelf: approximately 3,976–3,990.
• Intermediate Retest Pivot: approximately 3,935–3,949.
• Snapshot price: 3,911.685.
• Local Demand Shelf: approximately 3,867–3,880.
Zone boundaries are estimated from the chart scale.
PRIMARY SCENARIO — RETEST DEMAND, THEN REBUILD
IF a pullback holds local demand, or briefly sweeps beneath it and reclaims the zone, THEN watch for bullish M15 displacement and a defended higher low.
That confirmation would strengthen a corrective recovery toward the intermediate pivot.
TP1: Approximately 3,935–3,949.
The displayed Fibonacci measurement places the 61.8% retracement near that pivot, adding resistance confluence.
A sustained H1 close above 3,949 followed by a successful retest would strengthen the route toward the Supply Flip Shelf.
TP2: Approximately 3,976–3,990.
A pullback between these objectives would remain compatible with the projected route, provided the emerging bullish structure holds.
An H1 close below approximately 3,867 followed by a failed reclaim would invalidate the immediate demand-recovery thesis.
BEARISH ALTERNATIVE — THE BOUNCE FORMS ANOTHER LOWER HIGH
IF buyers fail at the intermediate pivot and bearish M15 structure develops, THEN attention returns to local demand.
If the recovery reaches the Supply Flip Shelf, watch for another potential rejection. Former support can become resistance, but that role reversal still requires price confirmation.
A bearish rejection there could first expose the intermediate pivot, then local demand if selling persists.
Acceptance above 3,949 would invalidate a rejection setup anchored to the intermediate pivot.
An H1 close above 3,990 followed by a defended retest would invalidate a bearish setup anchored to the Supply Flip Shelf and bring primary overhead supply into greater focus.
DEMAND FAILURE
IF price sustains an H1 breakdown below local demand and fails to reclaim it, THEN the projected recovery loses its foundation.
The current chart does not mark a lower target, so a deeper objective requires an updated technical map.
MMFLOW VIEW
The chart favours watching for a corrective recovery after a demand retest.
The evidence must develop in stages: demand holds, a higher low forms, and the intermediate pivot becomes support.
The projected selling response from the upper shelf is also conditional. Reaching resistance alone is insufficient confirmation.
Use the actual confirmation swing to define entry, stop placement and reward-to-risk.
A stronger bounce is possible. A broader reversal remains unconfirmed.
MARKET OVERVIEW
Lower oil prices and buying after the selloff offer some relief.
US manufacturing and employment releases remain important catalysts this week, while expectations of further Fed tightening keep the recovery sensitive to macro developments.
H1 TECHNICAL CONTEXT
The broader structure remains bearish following successive CHoCH and BOS formations.
The latest decline broke the Supply Flip Shelf and accelerated through the Intermediate Retest Pivot before reaching local demand.
Price has now rebounded toward 3,912.
This establishes an initial demand reaction, but the chart does not yet show a confirmed bullish H1 structure shift.
The projected route allows for a demand retest before another recovery attempt toward the intermediate pivot and, conditionally, the supply shelf.
KEY ZONES
• Primary overhead supply: approximately 4,074–4,088.
• Supply Flip Shelf: approximately 3,976–3,990.
• Intermediate Retest Pivot: approximately 3,935–3,949.
• Snapshot price: 3,911.685.
• Local Demand Shelf: approximately 3,867–3,880.
Zone boundaries are estimated from the chart scale.
PRIMARY SCENARIO — RETEST DEMAND, THEN REBUILD
IF a pullback holds local demand, or briefly sweeps beneath it and reclaims the zone, THEN watch for bullish M15 displacement and a defended higher low.
That confirmation would strengthen a corrective recovery toward the intermediate pivot.
TP1: Approximately 3,935–3,949.
The displayed Fibonacci measurement places the 61.8% retracement near that pivot, adding resistance confluence.
A sustained H1 close above 3,949 followed by a successful retest would strengthen the route toward the Supply Flip Shelf.
TP2: Approximately 3,976–3,990.
A pullback between these objectives would remain compatible with the projected route, provided the emerging bullish structure holds.
An H1 close below approximately 3,867 followed by a failed reclaim would invalidate the immediate demand-recovery thesis.
BEARISH ALTERNATIVE — THE BOUNCE FORMS ANOTHER LOWER HIGH
IF buyers fail at the intermediate pivot and bearish M15 structure develops, THEN attention returns to local demand.
If the recovery reaches the Supply Flip Shelf, watch for another potential rejection. Former support can become resistance, but that role reversal still requires price confirmation.
A bearish rejection there could first expose the intermediate pivot, then local demand if selling persists.
Acceptance above 3,949 would invalidate a rejection setup anchored to the intermediate pivot.
An H1 close above 3,990 followed by a defended retest would invalidate a bearish setup anchored to the Supply Flip Shelf and bring primary overhead supply into greater focus.
DEMAND FAILURE
IF price sustains an H1 breakdown below local demand and fails to reclaim it, THEN the projected recovery loses its foundation.
The current chart does not mark a lower target, so a deeper objective requires an updated technical map.
MMFLOW VIEW
The chart favours watching for a corrective recovery after a demand retest.
The evidence must develop in stages: demand holds, a higher low forms, and the intermediate pivot becomes support.
The projected selling response from the upper shelf is also conditional. Reaching resistance alone is insufficient confirmation.
Use the actual confirmation swing to define entry, stop placement and reward-to-risk.
Trade closed: target reached
Gold has successfully completed the projected bullish recovery after reacting strongly from the 3,870–3,880 Local Demand Shelf.
The rebound gained momentum as buyers reclaimed short-term structure and pushed through the 3,935–3,950 Intermediate Retest Pivot.
Price extended toward 3,970, completing the projected 92.7-point upside expansion before encountering selling pressure.
With the initial objective achieved, attention now shifts to whether buyers can defend the retest pivot or if bearish momentum resumes beneath the 3,975–3,990 Supply Flip Shelf.
Target reached. Bullish reaction delivered. No need to chase.

⚜️Trade with Money Market Flow, logic, Price action
🔥Live Market Updates-Realtime Trading Plans & Signal
t.me/+sBwjxIJbdoFmNjk1
⚜️Risk Reward 1.3 to 2.5...
⚜️Daily 8 to 16 Signals VIP
MMFLOW gives you precision entries & BIGWIN profits
🔥Live Market Updates-Realtime Trading Plans & Signal
t.me/+sBwjxIJbdoFmNjk1
⚜️Risk Reward 1.3 to 2.5...
⚜️Daily 8 to 16 Signals VIP
MMFLOW gives you precision entries & BIGWIN profits
Related publications
Disclaimer
The information and publications are not meant to be, and do not constitute, financial, investment, trading, or other types of advice or recommendations supplied or endorsed by TradingView. Read more in the Terms of Use.
⚜️Trade with Money Market Flow, logic, Price action
🔥Live Market Updates-Realtime Trading Plans & Signal
t.me/+sBwjxIJbdoFmNjk1
⚜️Risk Reward 1.3 to 2.5...
⚜️Daily 8 to 16 Signals VIP
MMFLOW gives you precision entries & BIGWIN profits
🔥Live Market Updates-Realtime Trading Plans & Signal
t.me/+sBwjxIJbdoFmNjk1
⚜️Risk Reward 1.3 to 2.5...
⚜️Daily 8 to 16 Signals VIP
MMFLOW gives you precision entries & BIGWIN profits
Related publications
Disclaimer
The information and publications are not meant to be, and do not constitute, financial, investment, trading, or other types of advice or recommendations supplied or endorsed by TradingView. Read more in the Terms of Use.