
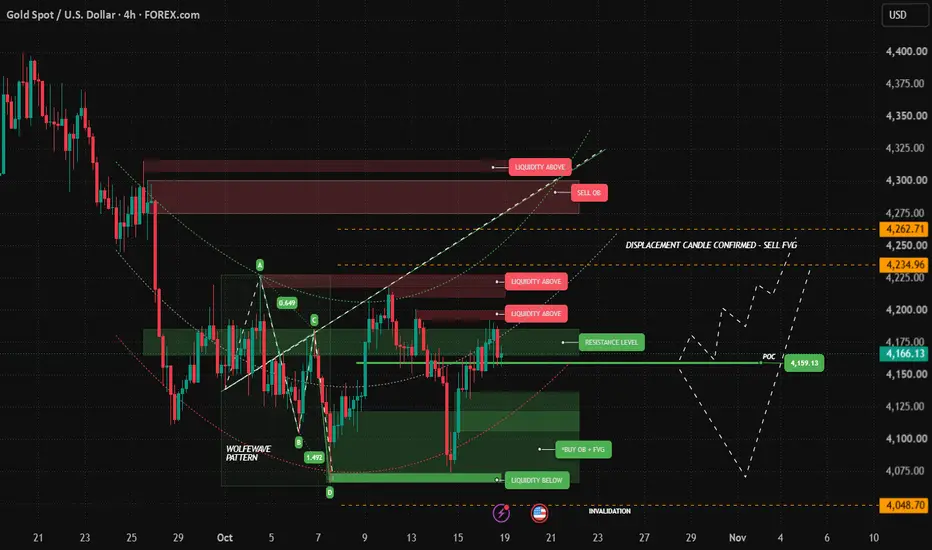
Gold has completed a Wolfe Wave pattern on the 4H timeframe. Point D was printed near the 4,065 area, a sweep of sell-side liquidity below the prior lows. The internal ratios fit the structure (0.649 retracement into C, 1.492 extension into D). Price reacted sharply from D, and the move suggests buyers defended that demand.
Price is now trading around 4,166, sitting right on the Point of Control (4,159) and pressing into a resistance band (≈4,160–4,180) that has capped price for most of October.
Key levels on the chart
Scenario (bullish)
A clean 4H close and hold above the 4,180 resistance opens the way toward the resting buy-side liquidity at 4,200 and 4,220. If momentum continues, the next magnet is the sell FVG at 4,235–4,262, followed by the sell OB at 4,275–4,300, where the Wolfe Wave target line converges. That confluence zone is where I expect sellers to step back in and will watch closely for reaction or reversal signals.
Alternate scenario (pullback first)
If price rejects the resistance/POC zone, I’d expect a retracement into the buy OB + FVG (4,100–4,135) before any continuation higher. A bullish reaction there would keep the Wolfe Wave structure intact and offer a better-located long.
Invalidation
A 4H close below 4,048.70 (beneath point D) invalidates the Wolfe Wave setup. It would also put the lower liquidity and the broader downtrend back in control.
Summary
Bias stays bullish while price holds above D. The upside targets are the liquidity pools and the 4,235–4,300 supply cluster. Be patient at resistance and let price confirm before committing.
This idea is for educational purposes only and is not financial advice. Always manage your risk and use proper position sizing.
Price is now trading around 4,166, sitting right on the Point of Control (4,159) and pressing into a resistance band (≈4,160–4,180) that has capped price for most of October.
Key levels on the chart
- Resistance / POC: 4,159 – 4,180
- Liquidity above: ~4,200, ~4,220, and ~4,310
- Sell FVG (displacement candle confirmed): 4,234.96 – 4,262.71
- Sell OB: ~4,275 – 4,300. This is also where the Wolfe Wave 1–4 target line runs.
- Buy OB + FVG: ~4,100 – 4,135
- Liquidity below: ~4,065 – 4,070
- Invalidation: 4,048.70
Scenario (bullish)
A clean 4H close and hold above the 4,180 resistance opens the way toward the resting buy-side liquidity at 4,200 and 4,220. If momentum continues, the next magnet is the sell FVG at 4,235–4,262, followed by the sell OB at 4,275–4,300, where the Wolfe Wave target line converges. That confluence zone is where I expect sellers to step back in and will watch closely for reaction or reversal signals.
Alternate scenario (pullback first)
If price rejects the resistance/POC zone, I’d expect a retracement into the buy OB + FVG (4,100–4,135) before any continuation higher. A bullish reaction there would keep the Wolfe Wave structure intact and offer a better-located long.
Invalidation
A 4H close below 4,048.70 (beneath point D) invalidates the Wolfe Wave setup. It would also put the lower liquidity and the broader downtrend back in control.
Summary
Bias stays bullish while price holds above D. The upside targets are the liquidity pools and the 4,235–4,300 supply cluster. Be patient at resistance and let price confirm before committing.
This idea is for educational purposes only and is not financial advice. Always manage your risk and use proper position sizing.

Disclaimer
The information and publications are not meant to be, and do not constitute, financial, investment, trading, or other types of advice or recommendations supplied or endorsed by TradingView. Read more in the Terms of Use.
Disclaimer
The information and publications are not meant to be, and do not constitute, financial, investment, trading, or other types of advice or recommendations supplied or endorsed by TradingView. Read more in the Terms of Use.