
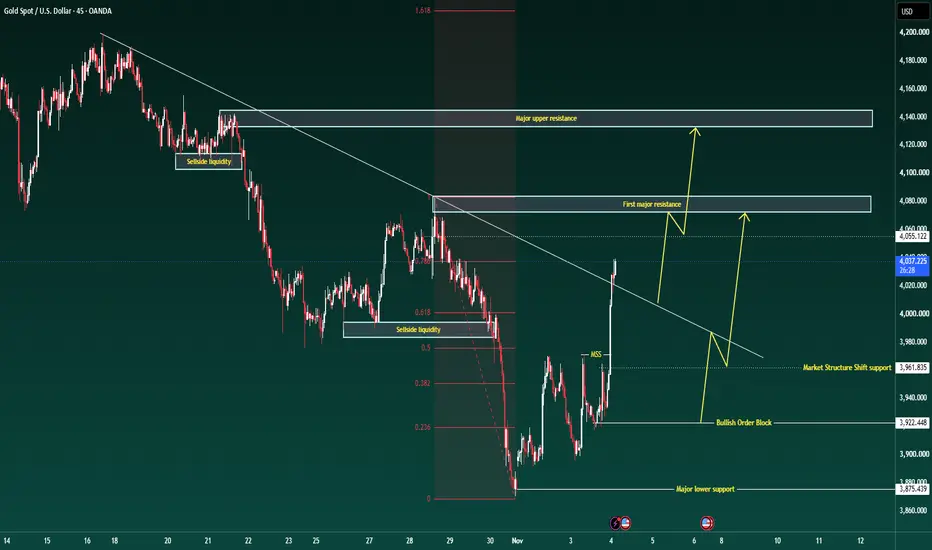
Gold is showing a strong bullish recovery after rebounding from the 3,875 support region and breaking above the short-term bearish market structure.
On the M45 chart, XAUUSD is trading near 4,031 after a sharp bullish displacement through the previous resistance around 3,962. The latest movement has also challenged the major descending trendline that previously controlled the market.
However, the broader structure remains under bearish pressure until buyers successfully reclaim the major resistance levels at 4,075-4,085 and 4,130-4,140.
My preferred outlook is a potential pullback toward 3,962-3,922 before another recovery attempt toward 4,080 and 4,140, provided buyers maintain the new bullish structure.
TECHNICAL STRUCTURE
1. Trendline - First Sign of a Bullish Breakout
The M45 chart shows a clear descending trendline extending from the October highs near 4,190.
Gold has repeatedly failed to sustain recovery above this trendline, forming lower highs throughout the recent bearish cycle.
However, the latest bullish displacement from 3,922 toward 4,031 has pushed price through the descending resistance.
This represents an early indication that bearish momentum may be weakening.
A confirmed breakout followed by a successful retest would strengthen the bullish recovery scenario.
The next important resistance is located around 4,075-4,085, followed by the major upper resistance at 4,130-4,140.
2. Fibonacci - Recovery Structure and Key Retracement Levels
The Fibonacci structure drawn from the previous decline highlights the importance of the current recovery.
Gold previously reacted around the 0.236 Fibonacci level near 3,922 before establishing a stronger bullish recovery.
The 0.382 and 0.5 levels were subsequently reclaimed, while the latest bullish movement has pushed above the 0.618 retracement around 4,000.
Price is now approaching the 0.786 Fibonacci reference near 4,035.
A sustained breakout above this area could strengthen bullish momentum toward 4,075-4,085.
However, a rejection near 4,035 may trigger a corrective pullback toward the previous breakout region.
3. ICT - Market Structure Shift and Order Block
From an ICT perspective, the latest recovery followed a liquidity reaction near 3,875.
Buyers subsequently established a bullish Market Structure Shift around 3,962, followed by strong bullish displacement toward 4,031.
This indicates that short-term order flow is shifting in favor of buyers.
The 3,922 region represents an important bullish Order Block reference and potential demand area during a corrective pullback.
If price revisits this region and produces bullish displacement, buyers may attempt another recovery toward higher liquidity.
However, the 4,075-4,085 zone remains a major resistance area where sellers could return.
IMPORTANT PRICE ZONES
Current price area: 4,025-4,035
Immediate Fibonacci resistance: 4,035
First major resistance: 4,075-4,085
Major upper resistance: 4,130-4,140
Breakout confirmation: 4,035-4,040
Market Structure Shift support: 3,962
Bullish Order Block: 3,920-3,925
Major lower support: 3,870-3,880
TRADING SCENARIOS
Primary Scenario - Buy After Corrective Pullback
My preferred setup is to wait for a pullback toward the previous bullish structure rather than chase the current breakout.
Entry Zone: 3,920-3,925, only after bullish rejection and a confirmed Market Structure Shift.
Stop Loss: Below the confirmed rejection low.
TP1: 3,962
TP2: 4,035
TP3: 4,075-4,085
Extended Target: 4,130-4,140, only after sustained acceptance above 4,085.
Alternative Scenario - Buy After Breakout Confirmation
If gold successfully breaks and maintains acceptance above 4,035-4,040, bullish momentum could strengthen.
Entry: After a confirmed breakout and successful retest above 4,035.
Stop Loss: Below the confirmed retest low.
TP1: 4,075-4,085
TP2: 4,130-4,140
Bearish Rejection Scenario
If gold fails to maintain the breakout and drops back below the descending trendline, the bullish recovery may weaken.
Entry: After confirmed bearish rejection around 4,030-4,040.
Stop Loss: Above the confirmed rejection high.
TP1: 4,000
TP2: 3,962
TP3: 3,920-3,925
FINAL VIEW
Gold is showing improving short-term bullish momentum after reclaiming key Fibonacci levels and challenging the descending trendline.
The recent bullish Market Structure Shift suggests that buyers are beginning to regain control, but the broader bearish structure has not yet been fully reversed.
My trading map:
Hold above 3,962: Short-term bullish recovery remains possible.
Retest 3,920-3,925: Watch for bullish confirmation.
Break above 4,035: Recovery momentum strengthens.
Reclaim 4,085: The next upside target becomes 4,130-4,140.
Reject 4,035: A corrective pullback toward 4,000 or 3,962 becomes possible.
Lose 3,922: The immediate bullish recovery structure weakens.
My preferred outlook is a controlled pullback toward 3,962-3,922 before a potential continuation toward 4,080 and 4,140.
The key focus is whether buyers can confirm the trendline breakout and maintain the recent bullish Market Structure Shift.
Will gold successfully break 4,035 and extend its recovery toward 4,140, or will sellers force another pullback before the next bullish attempt?
Which scenario are you watching?
Trade closed: target reached

🔥 BrianLionCapital – Where Top Traders Unite
✅ Accurate signals & exclusive analysis: 10–15 signals daily with continuous market insights
⏳ Every minute you hesitate is a winning opportunity slipping away!
t.me/+MLnZundgRZY2MTY9
✅ Accurate signals & exclusive analysis: 10–15 signals daily with continuous market insights
⏳ Every minute you hesitate is a winning opportunity slipping away!
t.me/+MLnZundgRZY2MTY9
Related publications
Disclaimer
The information and publications are not meant to be, and do not constitute, financial, investment, trading, or other types of advice or recommendations supplied or endorsed by TradingView. Read more in the Terms of Use.
🔥 BrianLionCapital – Where Top Traders Unite
✅ Accurate signals & exclusive analysis: 10–15 signals daily with continuous market insights
⏳ Every minute you hesitate is a winning opportunity slipping away!
t.me/+MLnZundgRZY2MTY9
✅ Accurate signals & exclusive analysis: 10–15 signals daily with continuous market insights
⏳ Every minute you hesitate is a winning opportunity slipping away!
t.me/+MLnZundgRZY2MTY9
Related publications
Disclaimer
The information and publications are not meant to be, and do not constitute, financial, investment, trading, or other types of advice or recommendations supplied or endorsed by TradingView. Read more in the Terms of Use.