
## **Market Overview**
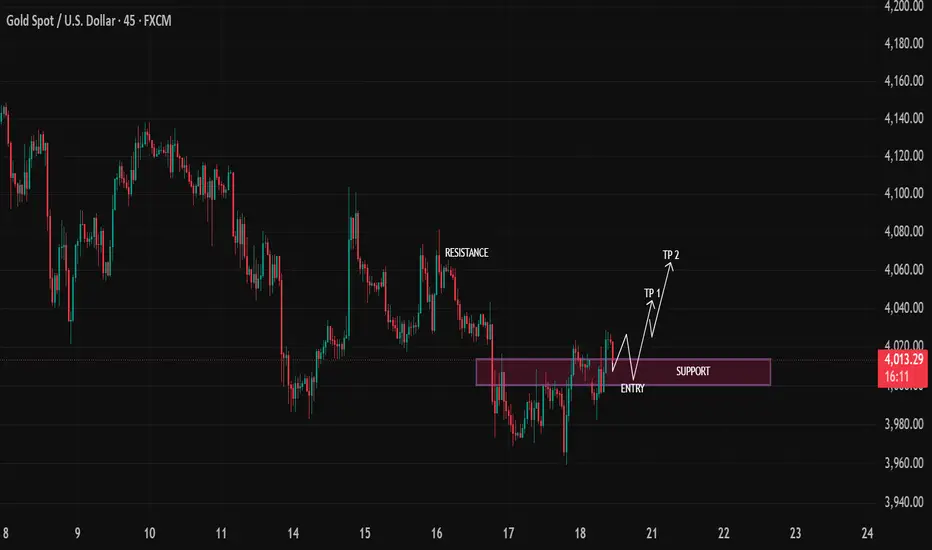
The 45-minute XAU/USD chart shows that gold remains in a **short-term recovery phase** after establishing a swing low around the **3,965–3,980** region. Buyers have regained momentum, pushing price back above the psychological **4,000** level while approaching a previous supply area.
Although the broader trend has recently been bearish, the current structure suggests a **potential trend continuation to the upside**, provided the marked support zone continues to hold.
---
# **Technical Structure**
### **1. Market Trend**
* **Higher Low Formation:** Bullish
* **Short-Term Momentum:** Positive
* **Overall Structure:** Recovery within a broader downtrend
Price has started printing higher lows after rejecting the recent lows, indicating buyers are gradually taking control.
---
### **2. Support Zone**
**Support Area:** **4,000 – 4,010**
This highlighted purple zone represents:
* Previous resistance turned support
* Multiple candle reactions
* Strong buying interest
* Psychological round-number support
As long as price remains above this area, the bullish scenario remains valid.
---
### **3. Resistance Zone**
Nearest resistance sits around:
**4,040 – 4,060**
This area has rejected price several times previously and could temporarily slow bullish momentum.
A successful breakout above this level would confirm stronger buying pressure.
---
# **Trade Scenario**
## **Preferred Setup: Buy the Pullback**
Rather than chasing price higher, waiting for a retracement into support provides a better risk-to-reward opportunity.
### **Entry**
* Buy near **4,000–4,010**
* Wait for bullish confirmation (bullish engulfing, pin bar, or strong rejection candle).
---
### **Stop Loss**
Below the recent swing low.
Suggested area:
**3,985–3,990**
---
### **Take Profit Targets**
**TP1**
* **4,040–4,045**
* Previous intraday resistance
**TP2**
* **4,055–4,065**
* Major resistance and projected measured move
---
# **Bullish Confirmation Signals**
Look for:
* Bullish engulfing candle
* Long lower wick rejection
* Strong buying volume
* Break above recent swing high
* Higher low maintained
These would strengthen the probability of continuation toward the target zones.
---
# **Invalidation Scenario**
The bullish outlook becomes weaker if:
* Price closes decisively below **4,000**
* Support fails with strong bearish momentum
* Lower lows begin forming
In that case, sellers could retest:
* **3,980**
* **3,965**
* **3,950**
---
# **Risk Management**
* Risk no more than **1–2%** of trading capital per position.
* Wait for confirmation before entering rather than placing a blind limit order.
* Aim for a **minimum risk-to-reward ratio of 1:2**, with **1:3** preferred if targeting TP2.
---
# **Professional Outlook**
The chart presents a **bullish pullback opportunity** rather than a breakout trade. The **4,000–4,010 support zone** is the key technical area to monitor. A confirmed bounce from this region could propel XAU/USD toward **4,040 (TP1)** and **4,060 (TP2)**. However, a decisive breakdown below support would invalidate the bullish setup and shift the short-term bias back to bearish.
**Bias:** **Moderately Bullish (Buy on Pullback)**
**Key Support:** **4,000–4,010**
**Key Resistance:** **4,040–4,060**
**Trading Strategy:** **Wait for a pullback into support, confirm buyer strength, then target higher resistance levels.**
The 45-minute XAU/USD chart shows that gold remains in a **short-term recovery phase** after establishing a swing low around the **3,965–3,980** region. Buyers have regained momentum, pushing price back above the psychological **4,000** level while approaching a previous supply area.
Although the broader trend has recently been bearish, the current structure suggests a **potential trend continuation to the upside**, provided the marked support zone continues to hold.
---
# **Technical Structure**
### **1. Market Trend**
* **Higher Low Formation:** Bullish
* **Short-Term Momentum:** Positive
* **Overall Structure:** Recovery within a broader downtrend
Price has started printing higher lows after rejecting the recent lows, indicating buyers are gradually taking control.
---
### **2. Support Zone**
**Support Area:** **4,000 – 4,010**
This highlighted purple zone represents:
* Previous resistance turned support
* Multiple candle reactions
* Strong buying interest
* Psychological round-number support
As long as price remains above this area, the bullish scenario remains valid.
---
### **3. Resistance Zone**
Nearest resistance sits around:
**4,040 – 4,060**
This area has rejected price several times previously and could temporarily slow bullish momentum.
A successful breakout above this level would confirm stronger buying pressure.
---
# **Trade Scenario**
## **Preferred Setup: Buy the Pullback**
Rather than chasing price higher, waiting for a retracement into support provides a better risk-to-reward opportunity.
### **Entry**
* Buy near **4,000–4,010**
* Wait for bullish confirmation (bullish engulfing, pin bar, or strong rejection candle).
---
### **Stop Loss**
Below the recent swing low.
Suggested area:
**3,985–3,990**
---
### **Take Profit Targets**
**TP1**
* **4,040–4,045**
* Previous intraday resistance
**TP2**
* **4,055–4,065**
* Major resistance and projected measured move
---
# **Bullish Confirmation Signals**
Look for:
* Bullish engulfing candle
* Long lower wick rejection
* Strong buying volume
* Break above recent swing high
* Higher low maintained
These would strengthen the probability of continuation toward the target zones.
---
# **Invalidation Scenario**
The bullish outlook becomes weaker if:
* Price closes decisively below **4,000**
* Support fails with strong bearish momentum
* Lower lows begin forming
In that case, sellers could retest:
* **3,980**
* **3,965**
* **3,950**
---
# **Risk Management**
* Risk no more than **1–2%** of trading capital per position.
* Wait for confirmation before entering rather than placing a blind limit order.
* Aim for a **minimum risk-to-reward ratio of 1:2**, with **1:3** preferred if targeting TP2.
---
# **Professional Outlook**
The chart presents a **bullish pullback opportunity** rather than a breakout trade. The **4,000–4,010 support zone** is the key technical area to monitor. A confirmed bounce from this region could propel XAU/USD toward **4,040 (TP1)** and **4,060 (TP2)**. However, a decisive breakdown below support would invalidate the bullish setup and shift the short-term bias back to bearish.
**Bias:** **Moderately Bullish (Buy on Pullback)**
**Key Support:** **4,000–4,010**
**Key Resistance:** **4,040–4,060**
**Trading Strategy:** **Wait for a pullback into support, confirm buyer strength, then target higher resistance levels.**

JOIN MY TELEGRAM CHANNEL FREE :
t.me/SMARTPROFITHUB2
t.me/SMARTPROFITHUB2
Disclaimer
The information and publications are not meant to be, and do not constitute, financial, investment, trading, or other types of advice or recommendations supplied or endorsed by TradingView. Read more in the Terms of Use.
JOIN MY TELEGRAM CHANNEL FREE :
t.me/SMARTPROFITHUB2
t.me/SMARTPROFITHUB2
Disclaimer
The information and publications are not meant to be, and do not constitute, financial, investment, trading, or other types of advice or recommendations supplied or endorsed by TradingView. Read more in the Terms of Use.