
Gold May Be Entering a Corrective Wave — Strong Data Is Starting to Matter Again
Gold still looks elevated on the chart, but the structure is beginning to suggest that the market may be shifting from impulsive upside into a corrective phase.
A small but important macro note first: the latest New York Fed Empire State Manufacturing Survey did not come in weak. The headline index actually rose to 11.0 in April, versus -0.5 expected and -0.2 prior, while new orders and shipments also improved. That matters because firmer activity data can support yields and the dollar on the margin, which often makes gold more vulnerable to short-term cooling after a strong run.
From a technical perspective, the chart is now at a very interesting point.
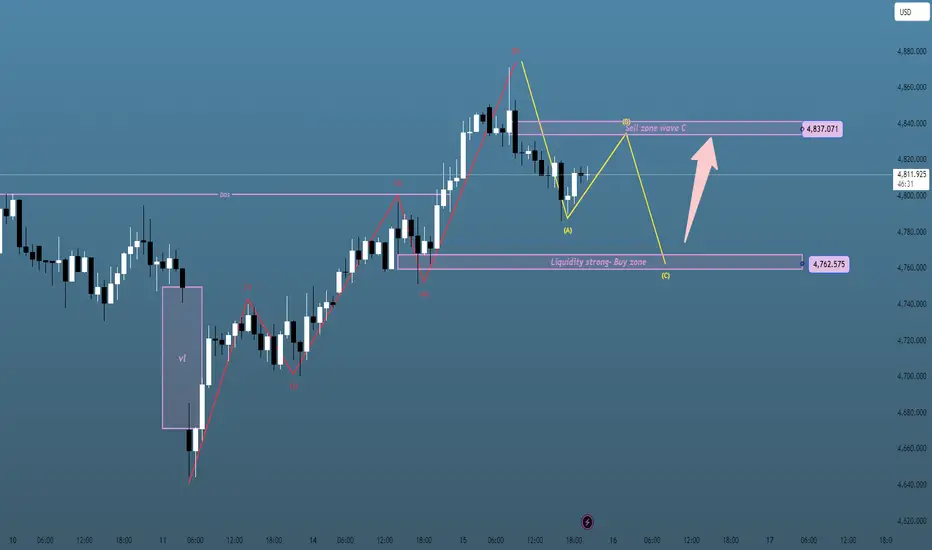
The previous advance looks like a completed 5-wave impulsive structure, and price is no longer moving with the same clean strength that defined the earlier rally. Instead, the market is beginning to trace what looks like an ABC correction, with price rotating under resistance rather than expanding away from it. That usually tells us momentum is becoming less one-sided.
Elliott structure on the chart
The key idea here is simple:
the impulsive move appears mature
price is now transitioning into a correction
the current rebound can be interpreted as a potential wave B retest
which leaves room for a wave C pullback if resistance holds
In other words, this is the kind of structure where traders should probably stop chasing the last bullish move and start paying closer attention to where the correction may want to complete.
Key zones to watch
Sell zone / Wave B resistance: around the 4835–4845 area
Near-term pivot: around 4800–4815
Liquidity strong buy zone / Wave C target: around 4760–4770
The upper zone matters because that is where the market may finish the rebound leg of the correction. If price pushes into that resistance area and starts to lose momentum again, the chart would fit a classic A-B-C pattern, with the next move rotating lower into the liquidity zone below.
Why the bearish correction scenario makes sense
What I find important is that price is no longer trending in a clean vertical way. The structure is becoming more segmented, more reactive, and more wave-like. That often happens when the market is no longer in pure expansion mode.
At the same time, the stronger-than-expected Empire State data gives the market a reason to slow gold’s upside in the short term. It does not automatically destroy the broader bullish picture, but it does make a pullback scenario more reasonable — especially when the chart is already showing a possible corrective sequence.
So for me, the issue is not whether gold is suddenly bearish in the bigger picture. The issue is whether the current structure is preparing for a healthy correction before the next directional move.
Main scenario
If gold continues to rebound into the 4835–4845 sell zone but fails to build acceptance above it, then the market may complete wave B and rotate lower into wave C.
That would open the path toward the 4760–4770 liquidity strong buy zone, which is the first area where buyers may become interesting again.
This is the cleaner technical scenario on the chart right now:
completed impulse → corrective rebound → wave C decline into support
Invalidation
If price breaks through the upper resistance and starts holding above it with clean momentum, then the corrective interpretation weakens. In that case, the market would no longer be behaving like a simple ABC retracement, and the structure would need to be reassessed.
Until then, I still prefer to treat strength near resistance with caution.
Cecilia’s view
Gold still has a strong larger story behind it, but this particular chart is beginning to feel less like continuation and more like correction inside strength.
That is an important distinction.
Because when a market stops expanding and starts moving in waves, the best opportunities often come after the correction, not in the middle of it.
So right now, I am not interested in emotional chasing near the top. I am more interested in whether the market completes this corrective path cleanly and gives a better reaction from lower support.
Final thought
The current structure suggests that gold may be entering a short-term corrective cycle, and the stronger-than-expected New York manufacturing data adds another reason for the market to pause before trying to push higher again.
For now, the cleaner map is:
rebound into resistance
watch for wave B exhaustion
look for wave C into the liquidity buy zone
That does not make gold weak. It simply means the market may need to breathe before the next real move.
Gold still looks elevated on the chart, but the structure is beginning to suggest that the market may be shifting from impulsive upside into a corrective phase.
A small but important macro note first: the latest New York Fed Empire State Manufacturing Survey did not come in weak. The headline index actually rose to 11.0 in April, versus -0.5 expected and -0.2 prior, while new orders and shipments also improved. That matters because firmer activity data can support yields and the dollar on the margin, which often makes gold more vulnerable to short-term cooling after a strong run.
From a technical perspective, the chart is now at a very interesting point.
The previous advance looks like a completed 5-wave impulsive structure, and price is no longer moving with the same clean strength that defined the earlier rally. Instead, the market is beginning to trace what looks like an ABC correction, with price rotating under resistance rather than expanding away from it. That usually tells us momentum is becoming less one-sided.
Elliott structure on the chart
The key idea here is simple:
the impulsive move appears mature
price is now transitioning into a correction
the current rebound can be interpreted as a potential wave B retest
which leaves room for a wave C pullback if resistance holds
In other words, this is the kind of structure where traders should probably stop chasing the last bullish move and start paying closer attention to where the correction may want to complete.
Key zones to watch
Sell zone / Wave B resistance: around the 4835–4845 area
Near-term pivot: around 4800–4815
Liquidity strong buy zone / Wave C target: around 4760–4770
The upper zone matters because that is where the market may finish the rebound leg of the correction. If price pushes into that resistance area and starts to lose momentum again, the chart would fit a classic A-B-C pattern, with the next move rotating lower into the liquidity zone below.
Why the bearish correction scenario makes sense
What I find important is that price is no longer trending in a clean vertical way. The structure is becoming more segmented, more reactive, and more wave-like. That often happens when the market is no longer in pure expansion mode.
At the same time, the stronger-than-expected Empire State data gives the market a reason to slow gold’s upside in the short term. It does not automatically destroy the broader bullish picture, but it does make a pullback scenario more reasonable — especially when the chart is already showing a possible corrective sequence.
So for me, the issue is not whether gold is suddenly bearish in the bigger picture. The issue is whether the current structure is preparing for a healthy correction before the next directional move.
Main scenario
If gold continues to rebound into the 4835–4845 sell zone but fails to build acceptance above it, then the market may complete wave B and rotate lower into wave C.
That would open the path toward the 4760–4770 liquidity strong buy zone, which is the first area where buyers may become interesting again.
This is the cleaner technical scenario on the chart right now:
completed impulse → corrective rebound → wave C decline into support
Invalidation
If price breaks through the upper resistance and starts holding above it with clean momentum, then the corrective interpretation weakens. In that case, the market would no longer be behaving like a simple ABC retracement, and the structure would need to be reassessed.
Until then, I still prefer to treat strength near resistance with caution.
Cecilia’s view
Gold still has a strong larger story behind it, but this particular chart is beginning to feel less like continuation and more like correction inside strength.
That is an important distinction.
Because when a market stops expanding and starts moving in waves, the best opportunities often come after the correction, not in the middle of it.
So right now, I am not interested in emotional chasing near the top. I am more interested in whether the market completes this corrective path cleanly and gives a better reaction from lower support.
Final thought
The current structure suggests that gold may be entering a short-term corrective cycle, and the stronger-than-expected New York manufacturing data adds another reason for the market to pause before trying to push higher again.
For now, the cleaner map is:
rebound into resistance
watch for wave B exhaustion
look for wave C into the liquidity buy zone
That does not make gold weak. It simply means the market may need to breathe before the next real move.

Disclaimer
The information and publications are not meant to be, and do not constitute, financial, investment, trading, or other types of advice or recommendations supplied or endorsed by TradingView. Read more in the Terms of Use.
Disclaimer
The information and publications are not meant to be, and do not constitute, financial, investment, trading, or other types of advice or recommendations supplied or endorsed by TradingView. Read more in the Terms of Use.