
The 9 & 14 EMA Magic: A Simple Trend-Following Edge
Can two simple EMAs help you stay on the right side of the trend?
The 9 EMA and 14 EMA crossover is one of the simplest momentum-based techniques I use for short-term trend identification.
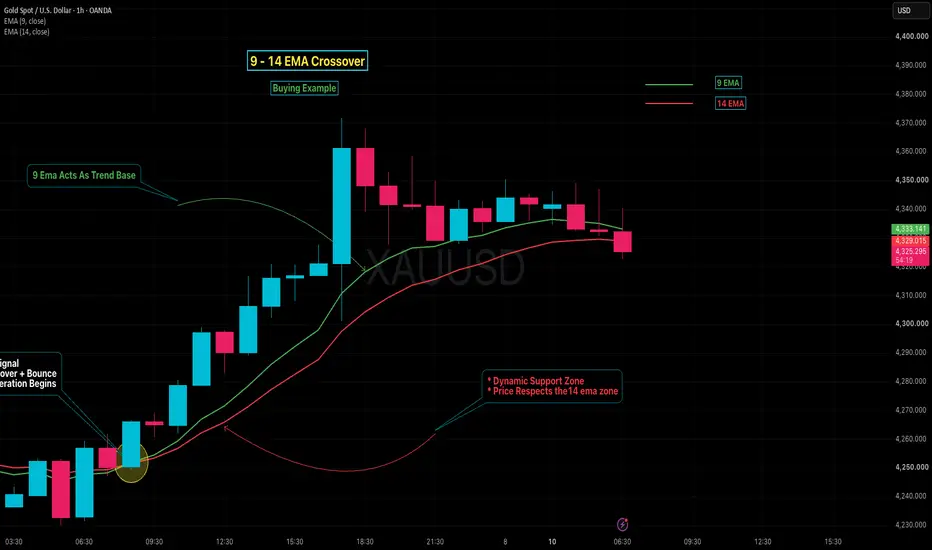
On the XAU/USD 1-hour chart, the setup offers an interesting observation:
🟣 Below is an example of a Short (Sell) setup on the Bank Nifty chart.

🔥 The Pattern
When the 9 EMA crosses above the 14 EMA, it signals that short-term momentum is beginning to outperform the underlying trend.
But the real edge isn't simply the crossover.
The magic happens when three conditions align:
🟢 9 EMA > 14 EMA
🟢 Price trades above both EMAs
🟢 Both EMAs are rising
When all three conditions are present, the crossover becomes a trend-following framework rather than a standalone buy signal.
📊 What This Chart Reveals
The recent XAU/USD move shows several important behaviours:
1️⃣ Crossover → Momentum Shift
The 9 EMA moving above the 14 EMA indicates improving short-term momentum.
2️⃣ Price → EMA Retest
Instead of chasing a large bullish candle, watch for price to return toward the 9/14 EMA zone.
3️⃣ EMA Zone → Dynamic Support
During a healthy uptrend, the EMA zone can act as dynamic support.
4️⃣ Separation → Trend Strength
When the 9 EMA pulls away from the 14 EMA, momentum is accelerating.
5️⃣ 9 EMA Crosses Back Below 14 EMA → Warning
This can signal that bullish momentum is weakening and the trend may be transitioning.
🟣 Below is an example setup of Option Buying on Sensex Options Chart.

🎯 My Trading Framework
Aggressive Entry:
9 EMA crosses above 14 EMA + bullish price confirmation.
Conservative Entry:
Wait for the first pullback toward the EMA zone and look for rejection.
Stop-Loss:
Below the recent swing low or below the 14 EMA, depending on volatility.
Exit:
Trail below the 9 EMA while momentum remains strong. A decisive 9/14 bearish crossover can be used as a trend-exit warning.
🟣 Below is an example setup of Options Selling on Nifty 50 Options Chart.

⚠️ The Important Lesson
Don't treat the crossover as a magic buy button.
In sideways markets, 9/14 EMA can produce multiple false signals.
The strongest setups generally occur when:
Crossover + Price Structure + Momentum + Trend = Alignment
That's where a simple indicator can become a powerful decision-making framework.
🧠 The Edge
You don't need 10 indicators covering your chart.
Sometimes, one fast EMA + one confirmation EMA + disciplined price action is enough to understand what the market is doing.
Follow the trend. Respect the EMAs. Let the market pay you.
Disclaimer
This analysis is shared strictly for educational and informational purposes. It is not financial or investment advice. Always perform your own research, use proper risk management, and trade according to your own strategy.
🔔 Subscribe for daily market insights, swing trade setups, and institutional-style technical analysis.
❤️ Market Wisdom to Remember: ❤️
⭐ Trade what you see, not what you assume
⭐ Follow the trend — it's your only true friend
⭐ The chart tells the real story — trust it
⭐ Emotions & assumptions have no place in trading
⭐ Capital protection comes first — always
💡 Your support matters! Like, comment, and follow to stay updated and motivated.
Cheers & Trade Smart! 🚀
Can two simple EMAs help you stay on the right side of the trend?
The 9 EMA and 14 EMA crossover is one of the simplest momentum-based techniques I use for short-term trend identification.
On the XAU/USD 1-hour chart, the setup offers an interesting observation:
🟣 Below is an example of a Short (Sell) setup on the Bank Nifty chart.
🔥 The Pattern
When the 9 EMA crosses above the 14 EMA, it signals that short-term momentum is beginning to outperform the underlying trend.
But the real edge isn't simply the crossover.
The magic happens when three conditions align:
🟢 9 EMA > 14 EMA
🟢 Price trades above both EMAs
🟢 Both EMAs are rising
When all three conditions are present, the crossover becomes a trend-following framework rather than a standalone buy signal.
📊 What This Chart Reveals
The recent XAU/USD move shows several important behaviours:
1️⃣ Crossover → Momentum Shift
The 9 EMA moving above the 14 EMA indicates improving short-term momentum.
2️⃣ Price → EMA Retest
Instead of chasing a large bullish candle, watch for price to return toward the 9/14 EMA zone.
3️⃣ EMA Zone → Dynamic Support
During a healthy uptrend, the EMA zone can act as dynamic support.
4️⃣ Separation → Trend Strength
When the 9 EMA pulls away from the 14 EMA, momentum is accelerating.
5️⃣ 9 EMA Crosses Back Below 14 EMA → Warning
This can signal that bullish momentum is weakening and the trend may be transitioning.
🟣 Below is an example setup of Option Buying on Sensex Options Chart.
🎯 My Trading Framework
Aggressive Entry:
9 EMA crosses above 14 EMA + bullish price confirmation.
Conservative Entry:
Wait for the first pullback toward the EMA zone and look for rejection.
Stop-Loss:
Below the recent swing low or below the 14 EMA, depending on volatility.
Exit:
Trail below the 9 EMA while momentum remains strong. A decisive 9/14 bearish crossover can be used as a trend-exit warning.
🟣 Below is an example setup of Options Selling on Nifty 50 Options Chart.
⚠️ The Important Lesson
Don't treat the crossover as a magic buy button.
In sideways markets, 9/14 EMA can produce multiple false signals.
The strongest setups generally occur when:
Crossover + Price Structure + Momentum + Trend = Alignment
That's where a simple indicator can become a powerful decision-making framework.
🧠 The Edge
You don't need 10 indicators covering your chart.
Sometimes, one fast EMA + one confirmation EMA + disciplined price action is enough to understand what the market is doing.
Follow the trend. Respect the EMAs. Let the market pay you.
Disclaimer
This analysis is shared strictly for educational and informational purposes. It is not financial or investment advice. Always perform your own research, use proper risk management, and trade according to your own strategy.
🔔 Subscribe for daily market insights, swing trade setups, and institutional-style technical analysis.
❤️ Market Wisdom to Remember: ❤️
⭐ Trade what you see, not what you assume
⭐ Follow the trend — it's your only true friend
⭐ The chart tells the real story — trust it
⭐ Emotions & assumptions have no place in trading
⭐ Capital protection comes first — always
💡 Your support matters! Like, comment, and follow to stay updated and motivated.
Cheers & Trade Smart! 🚀

Related publications
Disclaimer
The information and publications are not meant to be, and do not constitute, financial, investment, trading, or other types of advice or recommendations supplied or endorsed by TradingView. Read more in the Terms of Use.
Related publications
Disclaimer
The information and publications are not meant to be, and do not constitute, financial, investment, trading, or other types of advice or recommendations supplied or endorsed by TradingView. Read more in the Terms of Use.