
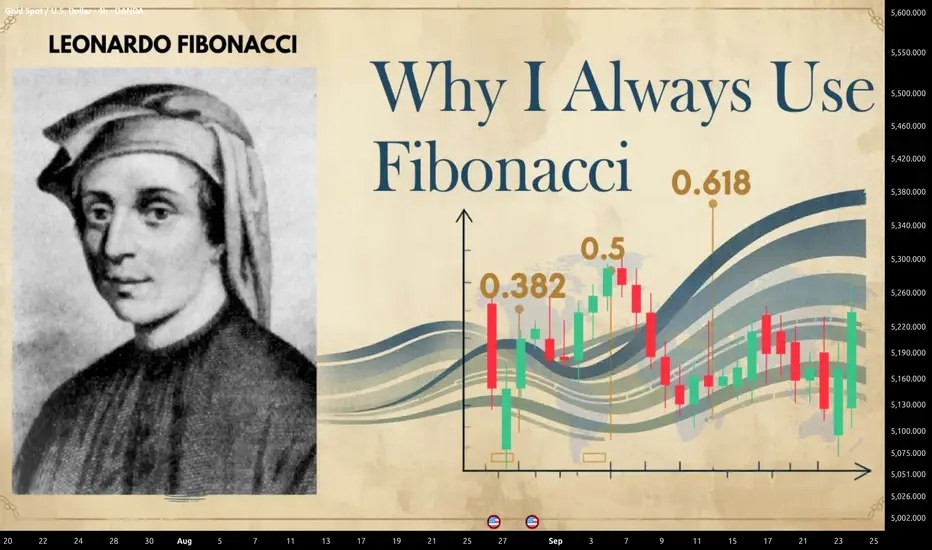
Fibonacci is one of the most debated tools in trading.
Some traders see 0.382, 0.5, and 0.618 as almost “magical” price zones. Others believe they are just numbers traders give meaning to.
In my view, both interpretations miss the point.
Fibonacci is useful not because it predicts the future, but because it helps measure the depth of a pullback and identify areas where price reaction may become important.
1. Fibonacci Is Not a Buy/Sell Button
Imagine the market is trending strongly higher and then starts to pull back.
Instead of guessing:
“Has price pulled back enough?”
Fibonacci helps divide the previous move into reference zones such as 38.2%, 50%, and 61.8%.
If price returns to 0.618, that does not mean you should automatically buy.
It simply tells me:
“This is an area worth watching. Now let’s see whether buyers actually return.”
2. Why Do Traders Watch 0.382 and 0.618?
In a strong trend, a shallow pullback near 0.382 can suggest that the side controlling the market is still aggressive.
Deeper retracements toward 0.5–0.618 may give price more room to “reset” before the trend continues.
One interesting detail: 0.5 is not actually a Fibonacci ratio, but traders still use it widely because the 50% retracement has long been important in technical analysis.
3. Fibonacci Works Best With Confluence
I rarely care about a Fibonacci level on its own.
It becomes more meaningful when it aligns with:
Support/Resistance + Market Structure + Previous Breakout Zone + Liquidity + Price Action.
For example:
Price pulls back to 0.618, reaches an old support zone, and shows a strong bullish reaction.
At that point, I am not buying because of “0.618”.
I am buying because multiple factors are telling the same story.
4. If the Anchor Points Are Wrong, Everything After That Is Wrong
This is a very common mistake.
Traders sometimes draw Fibonacci from almost any high and low until they find a level that looks “perfect”.
But Fibonacci is only useful when you identify the correct meaningful swing high and swing low for the move you are analysing.
Do not use the tool to prove what you want to see.
Use it to measure the move the market has actually created.
5. Do Not Turn 0.618 Into a Magic Number
Price may react at 0.618.
It may also break straight through it.
No ratio is strong enough to replace Stop Loss, invalidation, or risk management.
Fibonacci gives me an area to watch. Price Action decides whether there is a trade.
The Most Important Point
Leonardo Fibonacci did not invent Fibonacci Retracement for financial trading. He became famous for the number sequence popularised in Liber Abaci in the 13th century; applying related ratios to financial charts came much later.
That is why I do not see Fibonacci as a mystical forecasting tool.
I see it as a pullback measuring tool.
And when that measurement is placed correctly within trend, structure, and price reaction, it can still be extremely useful.
Do not ask: “Did price reach 0.618?”
Ask:
“If price reaches 0.618, how does the market react?”
That is the part that should drive the trading decision.
This article is for educational purposes only and does not constitute financial advice.
Some traders see 0.382, 0.5, and 0.618 as almost “magical” price zones. Others believe they are just numbers traders give meaning to.
In my view, both interpretations miss the point.
Fibonacci is useful not because it predicts the future, but because it helps measure the depth of a pullback and identify areas where price reaction may become important.
1. Fibonacci Is Not a Buy/Sell Button
Imagine the market is trending strongly higher and then starts to pull back.
Instead of guessing:
“Has price pulled back enough?”
Fibonacci helps divide the previous move into reference zones such as 38.2%, 50%, and 61.8%.
If price returns to 0.618, that does not mean you should automatically buy.
It simply tells me:
“This is an area worth watching. Now let’s see whether buyers actually return.”
2. Why Do Traders Watch 0.382 and 0.618?
In a strong trend, a shallow pullback near 0.382 can suggest that the side controlling the market is still aggressive.
Deeper retracements toward 0.5–0.618 may give price more room to “reset” before the trend continues.
One interesting detail: 0.5 is not actually a Fibonacci ratio, but traders still use it widely because the 50% retracement has long been important in technical analysis.
3. Fibonacci Works Best With Confluence
I rarely care about a Fibonacci level on its own.
It becomes more meaningful when it aligns with:
Support/Resistance + Market Structure + Previous Breakout Zone + Liquidity + Price Action.
For example:
Price pulls back to 0.618, reaches an old support zone, and shows a strong bullish reaction.
At that point, I am not buying because of “0.618”.
I am buying because multiple factors are telling the same story.
4. If the Anchor Points Are Wrong, Everything After That Is Wrong
This is a very common mistake.
Traders sometimes draw Fibonacci from almost any high and low until they find a level that looks “perfect”.
But Fibonacci is only useful when you identify the correct meaningful swing high and swing low for the move you are analysing.
Do not use the tool to prove what you want to see.
Use it to measure the move the market has actually created.
5. Do Not Turn 0.618 Into a Magic Number
Price may react at 0.618.
It may also break straight through it.
No ratio is strong enough to replace Stop Loss, invalidation, or risk management.
Fibonacci gives me an area to watch. Price Action decides whether there is a trade.
The Most Important Point
Leonardo Fibonacci did not invent Fibonacci Retracement for financial trading. He became famous for the number sequence popularised in Liber Abaci in the 13th century; applying related ratios to financial charts came much later.
That is why I do not see Fibonacci as a mystical forecasting tool.
I see it as a pullback measuring tool.
And when that measurement is placed correctly within trend, structure, and price reaction, it can still be extremely useful.
Do not ask: “Did price reach 0.618?”
Ask:
“If price reaches 0.618, how does the market react?”
That is the part that should drive the trading decision.
This article is for educational purposes only and does not constitute financial advice.

🚀 SMART CRYPTO TRADING STARTS HERE!
BTC • ETH • ALTCOINS
🎯 Daily Signals | Entry • TP • SL
⚡ Real-Time Alerts & Market Insights
💎 VIP Signals & Private Support
🔥 TRADE SMARTER. STAY AHEAD.
👇 JOIN OUR COMMUNITY
t.me/+22Cs-Z14bJg3NDJl
BTC • ETH • ALTCOINS
🎯 Daily Signals | Entry • TP • SL
⚡ Real-Time Alerts & Market Insights
💎 VIP Signals & Private Support
🔥 TRADE SMARTER. STAY AHEAD.
👇 JOIN OUR COMMUNITY
t.me/+22Cs-Z14bJg3NDJl
Related publications
Disclaimer
The information and publications are not meant to be, and do not constitute, financial, investment, trading, or other types of advice or recommendations supplied or endorsed by TradingView. Read more in the Terms of Use.
🚀 SMART CRYPTO TRADING STARTS HERE!
BTC • ETH • ALTCOINS
🎯 Daily Signals | Entry • TP • SL
⚡ Real-Time Alerts & Market Insights
💎 VIP Signals & Private Support
🔥 TRADE SMARTER. STAY AHEAD.
👇 JOIN OUR COMMUNITY
t.me/+22Cs-Z14bJg3NDJl
BTC • ETH • ALTCOINS
🎯 Daily Signals | Entry • TP • SL
⚡ Real-Time Alerts & Market Insights
💎 VIP Signals & Private Support
🔥 TRADE SMARTER. STAY AHEAD.
👇 JOIN OUR COMMUNITY
t.me/+22Cs-Z14bJg3NDJl
Related publications
Disclaimer
The information and publications are not meant to be, and do not constitute, financial, investment, trading, or other types of advice or recommendations supplied or endorsed by TradingView. Read more in the Terms of Use.