
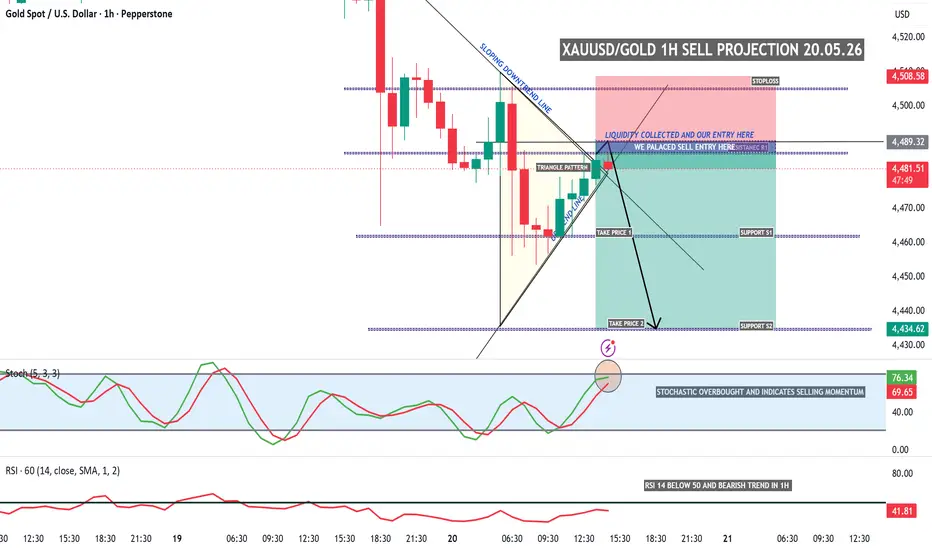
The 1-hour chart on XAUUSD currently shows a bearish setup forming inside a clear sloping downtrend structure. Price recently moved upward and collected liquidity near the resistance zone around 4489–4505, where strong rejection is expected. The market is also forming a triangle pattern, and after the breakout retest, sellers appear to be gaining control again. The highlighted sell entry zone near Resistance R1 indicates an area where institutional liquidity may have been collected before a potential downward move.
The stochastic indicator is already in the overbought region, signaling weakening bullish momentum and possible selling pressure. At the same time, RSI remains below the 50 level on the 1H timeframe, confirming that the overall trend is still bearish. As long as price stays below the major resistance and stop-loss zone around 4505, the probability favors continuation toward the downside targets.
The stochastic indicator is already in the overbought region, signaling weakening bullish momentum and possible selling pressure. At the same time, RSI remains below the 50 level on the 1H timeframe, confirming that the overall trend is still bearish. As long as price stays below the major resistance and stop-loss zone around 4505, the probability favors continuation toward the downside targets.

Disclaimer
The information and publications are not meant to be, and do not constitute, financial, investment, trading, or other types of advice or recommendations supplied or endorsed by TradingView. Read more in the Terms of Use.
Disclaimer
The information and publications are not meant to be, and do not constitute, financial, investment, trading, or other types of advice or recommendations supplied or endorsed by TradingView. Read more in the Terms of Use.