
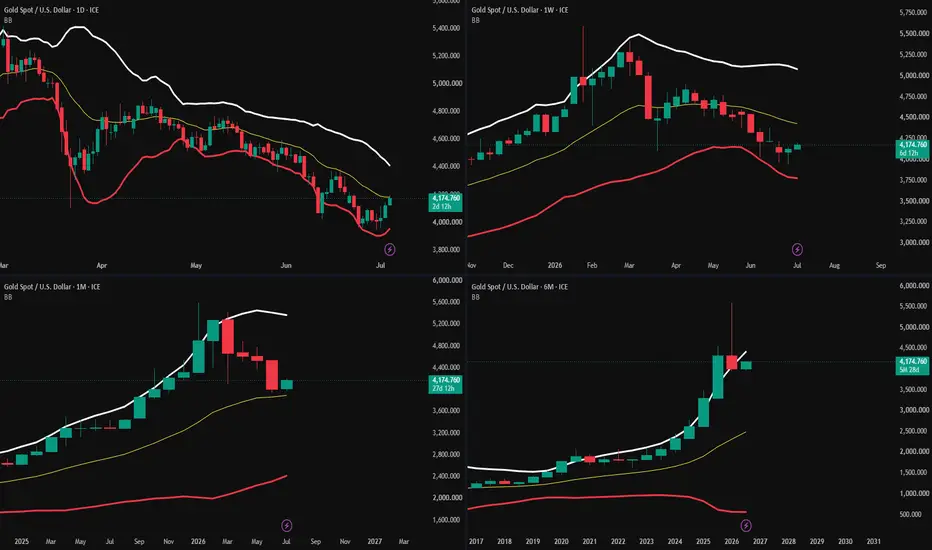
Daily (1D):
Medium-term downtrend remains intact.
Price has rebounded from the lower Bollinger Band.
Latest candles show a short-term recovery after a sharp decline.
Price is still below the Bollinger Band midline (yellow line).
Weekly (1W):
Previous strong uptrend has transitioned into a corrective phase.
Price has been making lower highs and lower lows since the peak.
Small bullish candles suggest selling pressure may be slowing.
Monthly (1M):
Long-term uptrend remains intact.
Recent months show a correction following a strong rally.
Price remains above the long-term moving average.
6-Month (6M):
Secular bullish trend remains unchanged.
Latest candle is consolidating after a strong advance.
No confirmed long-term trend reversal is visible.
Key Levels:
Support
≈ 4,000–4,050
Recent daily swing low
Near lower Bollinger Band
≈ 3,900
Major weekly support
Resistance
≈ 4,300–4,350
Daily Bollinger midline
Previous breakdown zone
≈ 4,500–4,600
Weekly resistance
≈ 5,000+
Major longer-term resistance
Bullish Scenario:
Confirmation would require:
Daily close above the Bollinger midline.
Break above recent lower highs.
Weekly candles continue printing higher lows.
Recovery toward 4,300–4,500.
This would indicate that the current bounce is evolving into a stronger corrective rally.
Bearish Scenario:
Confirmation would require:
Failure near the Bollinger midline.
Rejection from resistance around 4,250–4,350.
Breakdown below 4,000.
Continuation of lower highs on the weekly chart.
This would favor continuation of the existing medium-term downtrend.
Most Likely Next Trend:
Visible Facts
Long-term (Monthly and 6M) trend is still bullish.
Medium-term (Weekly and Daily) trend is corrective/down.
Daily chart shows an oversold rebound from the lower Bollinger Band.
No confirmed bullish reversal pattern is visible.
No volume or oscillator data are shown.
Interpretation
The higher-timeframe uptrend remains intact, but the daily and weekly charts still show a corrective structure. The recent bounce appears more like a counter-trend recovery than a confirmed trend reversal unless resistance is broken.
Probability-weighted bias (based only on the visible chart):
Bearish / Corrective continuation: 55%
Bullish recovery: 35%
Neutral consolidation: 10%
The highest-probability expectation is a test of overhead resistance, followed by a decision point. Until price reclaims the daily/weekly resistance area, the medium-term bias remains slightly bearish despite the long-term bullish structure.
Confidence Level:
Moderate (≈65%)
Reason:
Multiple higher timeframes are available, improving context.
Medium-term downtrend remains intact.
Price has rebounded from the lower Bollinger Band.
Latest candles show a short-term recovery after a sharp decline.
Price is still below the Bollinger Band midline (yellow line).
Weekly (1W):
Previous strong uptrend has transitioned into a corrective phase.
Price has been making lower highs and lower lows since the peak.
Small bullish candles suggest selling pressure may be slowing.
Monthly (1M):
Long-term uptrend remains intact.
Recent months show a correction following a strong rally.
Price remains above the long-term moving average.
6-Month (6M):
Secular bullish trend remains unchanged.
Latest candle is consolidating after a strong advance.
No confirmed long-term trend reversal is visible.
Key Levels:
Support
≈ 4,000–4,050
Recent daily swing low
Near lower Bollinger Band
≈ 3,900
Major weekly support
Resistance
≈ 4,300–4,350
Daily Bollinger midline
Previous breakdown zone
≈ 4,500–4,600
Weekly resistance
≈ 5,000+
Major longer-term resistance
Bullish Scenario:
Confirmation would require:
Daily close above the Bollinger midline.
Break above recent lower highs.
Weekly candles continue printing higher lows.
Recovery toward 4,300–4,500.
This would indicate that the current bounce is evolving into a stronger corrective rally.
Bearish Scenario:
Confirmation would require:
Failure near the Bollinger midline.
Rejection from resistance around 4,250–4,350.
Breakdown below 4,000.
Continuation of lower highs on the weekly chart.
This would favor continuation of the existing medium-term downtrend.
Most Likely Next Trend:
Visible Facts
Long-term (Monthly and 6M) trend is still bullish.
Medium-term (Weekly and Daily) trend is corrective/down.
Daily chart shows an oversold rebound from the lower Bollinger Band.
No confirmed bullish reversal pattern is visible.
No volume or oscillator data are shown.
Interpretation
The higher-timeframe uptrend remains intact, but the daily and weekly charts still show a corrective structure. The recent bounce appears more like a counter-trend recovery than a confirmed trend reversal unless resistance is broken.
Probability-weighted bias (based only on the visible chart):
Bearish / Corrective continuation: 55%
Bullish recovery: 35%
Neutral consolidation: 10%
The highest-probability expectation is a test of overhead resistance, followed by a decision point. Until price reclaims the daily/weekly resistance area, the medium-term bias remains slightly bearish despite the long-term bullish structure.
Confidence Level:
Moderate (≈65%)
Reason:
Multiple higher timeframes are available, improving context.

Disclaimer
The information and publications are not meant to be, and do not constitute, financial, investment, trading, or other types of advice or recommendations supplied or endorsed by TradingView. Read more in the Terms of Use.
Disclaimer
The information and publications are not meant to be, and do not constitute, financial, investment, trading, or other types of advice or recommendations supplied or endorsed by TradingView. Read more in the Terms of Use.