
Gold Technical Analysis Strategy: Hawkish Pressure Aligns with D
Gold Technical Analysis Strategy: Hawkish Pressure Aligns with Downward Trend—Prioritize Selling into Rallies
Fundamentals: The Fed’s Hawkish Stance Persists, Capping Gold’s Rebound
At its October meeting, the Federal Reserve kept interest rates unchanged at 3.75%–4.00%; however, the vote revealed a split, with two members favoring a rate hike. The policy statement upgraded the economic assessment from "solid" to "strong," while inflation remains elevated. Chair Warsh declined to provide forward guidance, emphasizing that the 2% PCE inflation target remains a rigid constraint. The market currently assigns an over 85% probability to a rate hike in December. A high-interest-rate environment combined with a strong U.S. dollar continues to weigh on the valuation of non-interest-bearing assets, and persistent outflows from gold ETFs further underscore the pressure on the metal. While geopolitical risks provide a floor, the short-term macroeconomic narrative has shifted back to a hawkish bias, limiting the scope for any rebound in gold prices.
Technical Analysis: Intact Downward Structure Confirmed by Stalled Rebound
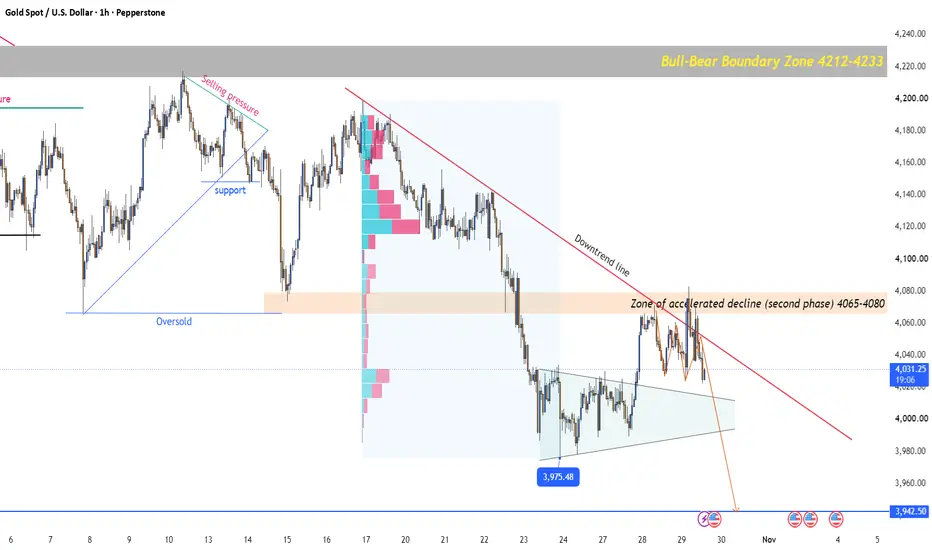
Chart analysis shows that the downward trend line (marked in red) originating from the previous high is exerting significant pressure. After encountering resistance in the 4065–4080 "accelerated decline zone"—now confirmed as a robust supply zone—the price retreated sharply. Currently trading near 4026, gold has once again fallen below the 4053 level, which serves as a short-term pivot point between bullish and bearish sentiment. The moving averages are in a bearish alignment, with the 20-day moving average (near 4120) and the 100-day moving average (near 4218) acting as formidable overhead resistance. To the downside, the psychological 4000 level serves as immediate support; a decisive break below this would open the path toward 3975 (a low marked on the chart) and 3942 (the lower blue support line).
Personal Outlook: Treat Rallies as Selling Opportunities
Given the confluence of a hawkish fundamental backdrop and a technical breakdown, my bias remains to sell into any corrective rallies. Any rebound toward the 4050–4080 zone—provided it fails to establish a firm foothold above this range—should be viewed as an opportunity for bears to re-enter the market. Given the current structure, chasing long positions carries high risk and offers a poor risk-to-reward ratio. Downside targets are set at 4000 and 3975, with 3942 as an extreme target. Should the price unexpectedly stage a strong recovery above 4120 (the 20-day moving average), the bearish thesis will need to be re-evaluated.
Strategy Highlights
Core Stance: Sell into rebounds; trade in the direction of the prevailing trend.
Entry Reference: Look for selling opportunities when the price faces resistance within the 4050–4080 zone.
Risk Management (Stop-Loss): Above 4080 (exit the position if the price breaks through, as this would signal an acceleration in the decline).
Target Zones: Primary target at 4000; secondary targets at 3975–3942.
If you have a different outlook on the future direction of gold, or if you would like to explore the technical structure of other assets, please feel free to share your thoughts in the comments section. Happy trading!
Trade active
Gold Technical Analysis Strategy: Pullback Following Double-Top Resistance; Bearish Bias Remains After Rebound/Correction
Market Structure: Double-Top Confirmed; Pressure at the Critical Threshold
Looking at the current XAUUSD trend, the price has repeatedly tested the 4065–4080 zone—a critical battleground between bulls and bears—without achieving a decisive breakout. A double-top pattern has formed, leading to a pullback; this zone has effectively shifted from support to resistance. However, it should be noted that the preceding bullish structure has not been entirely invalidated, and significant support remains near the 4010 level. The overall market dynamic follows a pattern of "rebound/correction after a major downtrend, followed by a resumption of the decline." Currently trading near 4030, the price sits in a contested zone, with the directional bias still leaning toward a continuation of the bearish trend.
Trading Strategy: Sell into Rebounds; Define Clear Stop-Losses
Given the double-top formation and the resistance at the critical threshold, the primary strategy is to sell into rebounds. The 4030–4035 area serves as a short-term resistance zone, offering an opportunity to initiate short positions. Place a stop-loss at 4060 (just above the lower boundary of the critical threshold); should the price strongly reclaim this level, the double-top thesis is invalidated, and one should exit the position and move to the sidelines. Targets are set at 4020, 4005, and 3990, as the price tests support levels below. Trading Plan (XAUUSD)
Direction: SELL (Short on a rebound)
Entry Range: 4030 – 4035
Stop Loss (SL): 4060
Take Profit (TP): 4020 / 4005 / 3990
Rationale: Pullback following a double-top pattern; resistance encountered near the 4065–4080 threshold; downward correction within the broader market structure.
Risk Warning
If the price establishes a firm position above 4060, the double-top structure is invalidated—ensure the stop loss is strictly applied to short positions. If the support level at 4010 is broken decisively, consider adding to the short position in the direction of the trend, targeting lower levels. Manage your position size carefully and adhere to strict risk control.
Like, Follow, and Comment: If you have a different perspective on the current double-top structure in gold or the subsequent support levels, feel free to share your thoughts in the comments section.
Trade closed: target reached
Gold Shows Signs of Weakness After Repeated Tests of Support; Bearish Trend Persists
Bulls Lack Momentum; Support Zone Under Threat
Looking at the current XAUUSD price action, the asset has tested the 4020–4015 support zone multiple times. Despite short-term fluctuations, each rebound has been met with a swift pullback—a clear indication that bullish sentiment is weak and buying interest is limited. The 4005 level serves as a critical support point from the previous corrective decline; a decisive break below this level would open the door for further downward movement toward the 3980–3975 zone.
Structural Analysis: Confluence of Trendline Pressure and Resistance Levels
While there may be some speculative potential for a long position, one cannot ignore the pressure from the descending trendline above. This trendline converges with resistance from a previous consolidation platform, creating a formidable zone of overhead pressure. This dual-resistance structure—a combination of a trendline and a price platform—severely limits the scope for any rebound, reinforcing the prevailing bearish outlook.
Trading Strategy: Maintain Short Positions; Follow the Trend
The overall bearish bias remains unchanged. Existing short positions should be held; any rebound toward the resistance zone can be viewed as an opportunity to add to existing positions or initiate new shorts. Monitor the critical support at 4005—a breakdown here suggests targeting the 3980–3975 area.
Key Trading Points
Core Direction: Bearish; hold short positions.
Critical Support: 4005 (a break below points toward 3980–3975).
Overhead Resistance: The confluence zone formed by the descending trendline and the resistance platform.
Trading Advice: Continue holding short positions; consider adding to shorts if rebounds encounter resistance. Ensure strict risk management.
Like, Follow, and Comment: If you have a different perspective on the critical 4005 support level or the future direction of gold, please share your thoughts in the comments section.

Disclaimer
The information and publications are not meant to be, and do not constitute, financial, investment, trading, or other types of advice or recommendations supplied or endorsed by TradingView. Read more in the Terms of Use.
Disclaimer
The information and publications are not meant to be, and do not constitute, financial, investment, trading, or other types of advice or recommendations supplied or endorsed by TradingView. Read more in the Terms of Use.