
🌐Hello traders! I’m Jack Blackwell, with 15 years of experience in analysis and trading in the futures and forex markets. Below are my technical analysis views based on the current XAUUSD (4H and 1H timeframes) chart structure.
✅ 4-Hour Trend Analysis
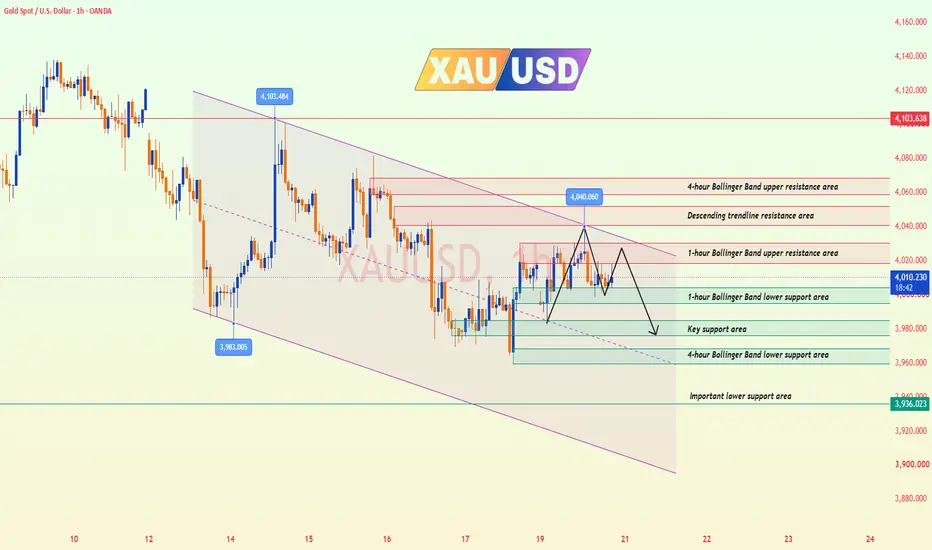
From the 4-hour timeframe, gold remains within a descending channel, with lower highs continuing to form, indicating that the medium-term bearish structure has not yet been broken.
The 4-hour Bollinger Band upper band is located at 4058.57, while the lower band is at 3962.58. The price is currently trading in the middle-to-lower section of the Bollinger Bands, suggesting limited upside potential and continued risk of a pullback. If gold fails to regain and stabilize above the 4010–4020 area, it is more likely to retest the support levels around 4000 and 3976.
✅ 1-Hour Trend Analysis
From the 1-hour timeframe, the current price is below the MA10 at 4012.47 and the MA20 at 4012.23, indicating that short-term rebound momentum has weakened significantly and the hourly structure has shifted back to a sideways-to-bearish bias.
The 1-hour Bollinger Band middle line is located at 4012.23, the upper band at 4029.36, and the lower band at 3995.09. The price is currently below the middle line and gradually approaching the lower band, showing that short-term selling pressure has gained some advantage. However, technical buying support may emerge around the 3995–4000 area.
🔴 Key Resistance Levels
● 4018–4029: 1-hour Bollinger Band upper resistance area
● 4040–4054: Descending trendline resistance area
● 4058–4064: 4-hour Bollinger Band upper resistance area
🟢 Key Support Levels
● 4000–3995: 1-hour Bollinger Band lower support area
● 3985–3976: Key support area
● 3963–3959: 4-hour Bollinger Band lower support area
● Around 3936: Important lower support area
✅ Trading Strategy Reference
🔰 Short Position Strategy
👉 Sell Zone 1: 4018–4028
👉 Sell Zone 2: 4040–4050
🎯 Targets: 4000 → 3985 → 3976 → 3962
🔰 Long Position Strategy
👉 Buy Zone 1: 4000–3995
👉 Buy Zone 2: 3985–3976
🎯 Targets: 4012 → 4025 → 4029 → 4040
⚠️ The hourly chart has already broken below the short-term ascending trendline. Therefore, long positions are better considered only after clear signs of stabilization appear within the support zones, rather than chasing the price higher from the middle of the range. If gold falls below 3995 and fails to recover quickly, it may continue declining toward 3976. If 3959 is also broken, the rebound structure will largely become invalid, and the price may continue falling toward 3936 or even 3912.
🔔 If you find my analysis helpful, please like, share, and stay tuned for future updates. Your support is my motivation to continue sharing professional insights. Wishing everyone smooth trading and steady profits!
✅ 4-Hour Trend Analysis
From the 4-hour timeframe, gold remains within a descending channel, with lower highs continuing to form, indicating that the medium-term bearish structure has not yet been broken.
The 4-hour Bollinger Band upper band is located at 4058.57, while the lower band is at 3962.58. The price is currently trading in the middle-to-lower section of the Bollinger Bands, suggesting limited upside potential and continued risk of a pullback. If gold fails to regain and stabilize above the 4010–4020 area, it is more likely to retest the support levels around 4000 and 3976.
✅ 1-Hour Trend Analysis
From the 1-hour timeframe, the current price is below the MA10 at 4012.47 and the MA20 at 4012.23, indicating that short-term rebound momentum has weakened significantly and the hourly structure has shifted back to a sideways-to-bearish bias.
The 1-hour Bollinger Band middle line is located at 4012.23, the upper band at 4029.36, and the lower band at 3995.09. The price is currently below the middle line and gradually approaching the lower band, showing that short-term selling pressure has gained some advantage. However, technical buying support may emerge around the 3995–4000 area.
🔴 Key Resistance Levels
● 4018–4029: 1-hour Bollinger Band upper resistance area
● 4040–4054: Descending trendline resistance area
● 4058–4064: 4-hour Bollinger Band upper resistance area
🟢 Key Support Levels
● 4000–3995: 1-hour Bollinger Band lower support area
● 3985–3976: Key support area
● 3963–3959: 4-hour Bollinger Band lower support area
● Around 3936: Important lower support area
✅ Trading Strategy Reference
🔰 Short Position Strategy
👉 Sell Zone 1: 4018–4028
👉 Sell Zone 2: 4040–4050
🎯 Targets: 4000 → 3985 → 3976 → 3962
🔰 Long Position Strategy
👉 Buy Zone 1: 4000–3995
👉 Buy Zone 2: 3985–3976
🎯 Targets: 4012 → 4025 → 4029 → 4040
⚠️ The hourly chart has already broken below the short-term ascending trendline. Therefore, long positions are better considered only after clear signs of stabilization appear within the support zones, rather than chasing the price higher from the middle of the range. If gold falls below 3995 and fails to recover quickly, it may continue declining toward 3976. If 3959 is also broken, the rebound structure will largely become invalid, and the price may continue falling toward 3936 or even 3912.
🔔 If you find my analysis helpful, please like, share, and stay tuned for future updates. Your support is my motivation to continue sharing professional insights. Wishing everyone smooth trading and steady profits!

✅ Real-time professional trading guidance
✅ Clear and well-structured trading strategies
✅ 3–5 carefully selected trading signals per day
✅ Daily profit target of 500–1,000 pips
💎 VIP Guidance Channel:t.me/+CR7q5ko39YNjOWRl
✅ Clear and well-structured trading strategies
✅ 3–5 carefully selected trading signals per day
✅ Daily profit target of 500–1,000 pips
💎 VIP Guidance Channel:t.me/+CR7q5ko39YNjOWRl
Disclaimer
The information and publications are not meant to be, and do not constitute, financial, investment, trading, or other types of advice or recommendations supplied or endorsed by TradingView. Read more in the Terms of Use.
✅ Real-time professional trading guidance
✅ Clear and well-structured trading strategies
✅ 3–5 carefully selected trading signals per day
✅ Daily profit target of 500–1,000 pips
💎 VIP Guidance Channel:t.me/+CR7q5ko39YNjOWRl
✅ Clear and well-structured trading strategies
✅ 3–5 carefully selected trading signals per day
✅ Daily profit target of 500–1,000 pips
💎 VIP Guidance Channel:t.me/+CR7q5ko39YNjOWRl
Disclaimer
The information and publications are not meant to be, and do not constitute, financial, investment, trading, or other types of advice or recommendations supplied or endorsed by TradingView. Read more in the Terms of Use.