
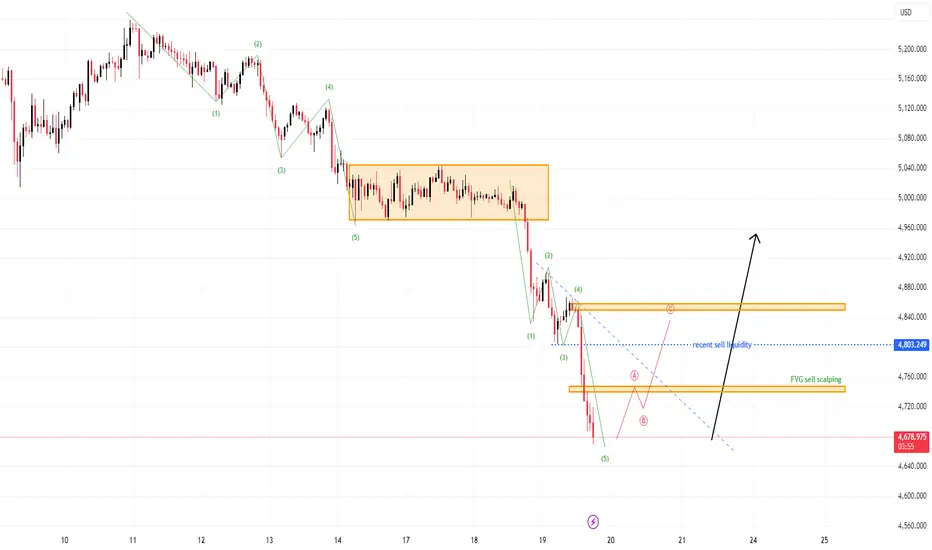
XAUUSD (H1) — The downtrend is still dominant, but the better setup may soon shift from selling to reversal trading
Gold is still trading inside a very clear bearish sequence on H1.
The chart continues to print lower highs and lower lows, and the latest breakdown shows that sellers are still controlling the broader move. From a structural point of view, this is still a market under heavy pressure, not a market that has completed reversal confirmation.
However, the chart is now entering a different stage of the trend.
The sell side is still dominant, but the easy short entries are no longer as clean as they were earlier in the move.
Structure reading
Looking at the chart, the bearish flow has already developed through a fairly complete impulsive decline.
The market moved from a larger consolidation block near the 5000–5040 region, then broke sharply lower and continued printing a fresh sequence of lower swing points.
The wave labels on the chart also suggest that the move is already deep into a 5-wave decline, with the current leg likely approaching the later stage of that sequence.
That matters because once wave 5 becomes extended, the risk starts to change:
trend direction may still be bearish
but fresh sell entries become less efficient
and the probability of a corrective rebound begins to increase
So the chart is still bearish, but not in the same “high-quality short entry” condition as before.
Key technical zones from the chart
1. Upper supply / recovery cap around 484x–485x
This is the first recovery ceiling marked on the chart.
If gold starts to rebound from current lows, this is the nearest area where short-term supply may appear again.
For now, this zone is still acting as a technical cap.
A bounce into this area without strong follow-through would still look corrective.
2. Recent sell liquidity around 4803
This dotted horizontal level is important because it marks the recent sell-side liquidity reference.
Price has already moved through that area and is now trading below it, which confirms that the structure has weakened further.
Unless the market can reclaim that level with strength, the current breakdown remains valid.
3. FVG sell scalping zone around 474x
This is the lower orange zone shown on the chart.
Under normal trending conditions, such an area can still offer a reaction or short-term rejection, but the problem now is timing.
Because price is already extended into the lower part of the structure, Kelly does not see this as an attractive place to chase the sell side aggressively.
The move has already traveled far, which means reward-to-risk for fresh shorts is no longer ideal.
4. Current low area around 468x
This is where the market is now trading after the latest strong breakdown candle.
When price reaches this kind of stretched location after an impulsive fall, the market often enters one of two phases:
a final exhaustion push lower
or a technical rebound before the next larger corrective sequence begins
That is why the next opportunity may no longer come from trend-chasing, but from waiting for a reversal structure.
Why Kelly does not prefer a fresh sell here
This is the most important part of the chart.
Yes, the structure is still bearish.
Yes, sellers are still in control.
But the sell entry now is late.
The earlier short opportunities came from:
rejection below broken support
retest of supply
continuation from cleaner lower highs
Now price is already far below those better entry zones.
Selling here means entering after extension, when the downside may still continue but the quality of positioning has clearly dropped.
For Kelly, that is not ideal trading.
A correct bias does not automatically mean a correct entry.
What Kelly is watching next
The chart itself already hints at the next likely transition:
after the 5-wave decline completes, the market may begin an ABC corrective phase.
That does not mean gold becomes bullish immediately.
It means the first cleaner setup may come from a smaller-timeframe reversal structure, not from another late sell.
What Kelly wants to see now is:
price stops printing aggressive impulsive sell candles
a lower timeframe base begins to form
the market creates a higher low
broken intraday resistance gets reclaimed
a reversal pattern appears before any long idea is considered
In other words, the buy is not here yet — but the market may be getting closer to preparing one.
Scenario map
Main scenario
Gold may complete the final portion of wave 5, then begin a corrective rebound.
If that happens, the next move could develop as an ABC structure, with the first upside reaction likely aimed back toward the nearby recovery zones.
Secondary scenario
If sellers still force one more breakdown from current levels, the move may become a final exhaustion leg.
But even in that case, Kelly would still avoid chasing that weakness too late and would rather wait for the post-extension reversal pattern.
Kelly’s read
This chart is still bearish in structure, but no longer attractive for fresh aggressive selling.
That distinction matters.
For Kelly, the market has moved from a trend-following sell phase into a wait-for-reversal-preparation phase.
The bias remains down, but the better opportunity ahead may come from patience on the lower timeframe, not from selling after the move is already stretched.
Conclusion
Gold is still sitting in a clear bearish H1 structure, and the 5-wave decline appears close to completion.
The sell side still controls direction, but the entry quality for new shorts has deteriorated sharply after the latest extension.
That is why Kelly is no longer focused on chasing the downtrend here.
The better plan is to wait for the smaller timeframe to build a proper reversal structure. If wave 5 finishes as expected, the next meaningful move may come in the form of an ABC corrective rebound.
The trend is still bearish — but the next clean trade may belong to the patient buyer, not the late seller.
Gold is still trading inside a very clear bearish sequence on H1.
The chart continues to print lower highs and lower lows, and the latest breakdown shows that sellers are still controlling the broader move. From a structural point of view, this is still a market under heavy pressure, not a market that has completed reversal confirmation.
However, the chart is now entering a different stage of the trend.
The sell side is still dominant, but the easy short entries are no longer as clean as they were earlier in the move.
Structure reading
Looking at the chart, the bearish flow has already developed through a fairly complete impulsive decline.
The market moved from a larger consolidation block near the 5000–5040 region, then broke sharply lower and continued printing a fresh sequence of lower swing points.
The wave labels on the chart also suggest that the move is already deep into a 5-wave decline, with the current leg likely approaching the later stage of that sequence.
That matters because once wave 5 becomes extended, the risk starts to change:
trend direction may still be bearish
but fresh sell entries become less efficient
and the probability of a corrective rebound begins to increase
So the chart is still bearish, but not in the same “high-quality short entry” condition as before.
Key technical zones from the chart
1. Upper supply / recovery cap around 484x–485x
This is the first recovery ceiling marked on the chart.
If gold starts to rebound from current lows, this is the nearest area where short-term supply may appear again.
For now, this zone is still acting as a technical cap.
A bounce into this area without strong follow-through would still look corrective.
2. Recent sell liquidity around 4803
This dotted horizontal level is important because it marks the recent sell-side liquidity reference.
Price has already moved through that area and is now trading below it, which confirms that the structure has weakened further.
Unless the market can reclaim that level with strength, the current breakdown remains valid.
3. FVG sell scalping zone around 474x
This is the lower orange zone shown on the chart.
Under normal trending conditions, such an area can still offer a reaction or short-term rejection, but the problem now is timing.
Because price is already extended into the lower part of the structure, Kelly does not see this as an attractive place to chase the sell side aggressively.
The move has already traveled far, which means reward-to-risk for fresh shorts is no longer ideal.
4. Current low area around 468x
This is where the market is now trading after the latest strong breakdown candle.
When price reaches this kind of stretched location after an impulsive fall, the market often enters one of two phases:
a final exhaustion push lower
or a technical rebound before the next larger corrective sequence begins
That is why the next opportunity may no longer come from trend-chasing, but from waiting for a reversal structure.
Why Kelly does not prefer a fresh sell here
This is the most important part of the chart.
Yes, the structure is still bearish.
Yes, sellers are still in control.
But the sell entry now is late.
The earlier short opportunities came from:
rejection below broken support
retest of supply
continuation from cleaner lower highs
Now price is already far below those better entry zones.
Selling here means entering after extension, when the downside may still continue but the quality of positioning has clearly dropped.
For Kelly, that is not ideal trading.
A correct bias does not automatically mean a correct entry.
What Kelly is watching next
The chart itself already hints at the next likely transition:
after the 5-wave decline completes, the market may begin an ABC corrective phase.
That does not mean gold becomes bullish immediately.
It means the first cleaner setup may come from a smaller-timeframe reversal structure, not from another late sell.
What Kelly wants to see now is:
price stops printing aggressive impulsive sell candles
a lower timeframe base begins to form
the market creates a higher low
broken intraday resistance gets reclaimed
a reversal pattern appears before any long idea is considered
In other words, the buy is not here yet — but the market may be getting closer to preparing one.
Scenario map
Main scenario
Gold may complete the final portion of wave 5, then begin a corrective rebound.
If that happens, the next move could develop as an ABC structure, with the first upside reaction likely aimed back toward the nearby recovery zones.
Secondary scenario
If sellers still force one more breakdown from current levels, the move may become a final exhaustion leg.
But even in that case, Kelly would still avoid chasing that weakness too late and would rather wait for the post-extension reversal pattern.
Kelly’s read
This chart is still bearish in structure, but no longer attractive for fresh aggressive selling.
That distinction matters.
For Kelly, the market has moved from a trend-following sell phase into a wait-for-reversal-preparation phase.
The bias remains down, but the better opportunity ahead may come from patience on the lower timeframe, not from selling after the move is already stretched.
Conclusion
Gold is still sitting in a clear bearish H1 structure, and the 5-wave decline appears close to completion.
The sell side still controls direction, but the entry quality for new shorts has deteriorated sharply after the latest extension.
That is why Kelly is no longer focused on chasing the downtrend here.
The better plan is to wait for the smaller timeframe to build a proper reversal structure. If wave 5 finishes as expected, the next meaningful move may come in the form of an ABC corrective rebound.
The trend is still bearish — but the next clean trade may belong to the patient buyer, not the late seller.

📌 New analysis published daily
🔔 Follow this profile for real-time updates
⚠️ This is personal analysis, not financial advice
Daily GOLD and Forex updates: t.me/+_8wydjUbci5hMzJl
🔔 Follow this profile for real-time updates
⚠️ This is personal analysis, not financial advice
Daily GOLD and Forex updates: t.me/+_8wydjUbci5hMzJl
Related publications
Disclaimer
The information and publications are not meant to be, and do not constitute, financial, investment, trading, or other types of advice or recommendations supplied or endorsed by TradingView. Read more in the Terms of Use.
📌 New analysis published daily
🔔 Follow this profile for real-time updates
⚠️ This is personal analysis, not financial advice
Daily GOLD and Forex updates: t.me/+_8wydjUbci5hMzJl
🔔 Follow this profile for real-time updates
⚠️ This is personal analysis, not financial advice
Daily GOLD and Forex updates: t.me/+_8wydjUbci5hMzJl
Related publications
Disclaimer
The information and publications are not meant to be, and do not constitute, financial, investment, trading, or other types of advice or recommendations supplied or endorsed by TradingView. Read more in the Terms of Use.