
Hello, traders! 👋
Hope your trading is going well! 🚀
📊 4-Hour Trend Analysis
Gold has shown a noticeable rebound after falling to around 4000, with the price moving back above MA5 (4022.32), but still remaining below MA10 (4038.88) and MA20 (4033.74). This indicates that short-term bearish momentum has weakened, and the market is beginning to show signs of a technical rebound. However, the overall bearish structure has not yet been fully reversed.
Currently, the moving averages remain aligned as MA5 < MA20 < MA10, indicating that the price is still facing resistance from the medium-term moving averages. The 4-hour Bollinger Band middle line is located at 4033.74, making 4034–4040 a key zone for determining whether the rebound can continue.
📊 1-Hour Trend Analysis
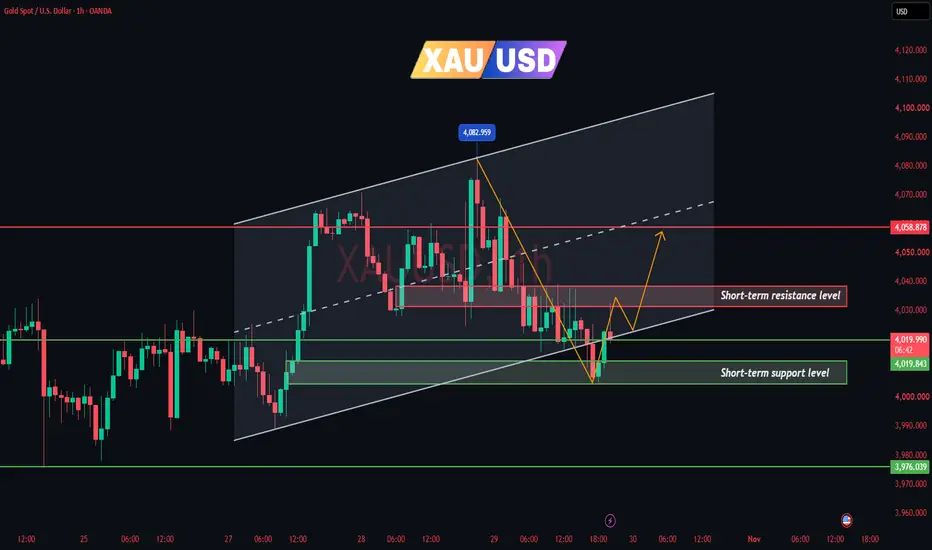
On the 1-hour chart, gold has experienced a series of bullish candles after falling to around 4007 and is now testing MA20 (4027.71). This suggests that short-term buying momentum is recovering, with the market attempting to shift from a bearish trend into a technical rebound.
However, the moving averages still maintain a bearish alignment, with MA5 < MA10 < MA20. Although the rebound has gained some momentum, a stable bullish trend has not yet been established.
Upside: Initial resistance is located at 4030–4040. If gold breaks above this zone and holds firmly on the 1-hour chart, the rebound could extend toward 4058–4060.
Downside: Key short-term support is located at 4020–4010. If this zone holds, the rebound may continue. However, if the price falls back below 4010, further downside toward 3993–3976 becomes possible.
✅ Trading Strategy
🔴 Sell on Rallies: Focus on the 4030–4040 resistance zone. If the price rebounds into this area but faces rejection and forms a bearish reversal candlestick on the 1-hour chart, consider opening short positions, targeting 4020 → 4003 → 3993.
If the price breaks above 4040 and holds firmly, abandon the short-selling setup in this zone and watch for potential resistance around 4058–4070.
🟢 Buy on Pullbacks: Watch the 4020–4010 support zone. If the price pulls back to this area, stabilizes, and shows clear bullish reversal signals, consider opening short-term long positions, targeting 4034 → 4040 → 4058.
👉 If you found this analysis helpful, please leave a like and share your thoughts in the comments!
❤️ Wishing you successful trading!
Hope your trading is going well! 🚀
📊 4-Hour Trend Analysis
Gold has shown a noticeable rebound after falling to around 4000, with the price moving back above MA5 (4022.32), but still remaining below MA10 (4038.88) and MA20 (4033.74). This indicates that short-term bearish momentum has weakened, and the market is beginning to show signs of a technical rebound. However, the overall bearish structure has not yet been fully reversed.
Currently, the moving averages remain aligned as MA5 < MA20 < MA10, indicating that the price is still facing resistance from the medium-term moving averages. The 4-hour Bollinger Band middle line is located at 4033.74, making 4034–4040 a key zone for determining whether the rebound can continue.
📊 1-Hour Trend Analysis
On the 1-hour chart, gold has experienced a series of bullish candles after falling to around 4007 and is now testing MA20 (4027.71). This suggests that short-term buying momentum is recovering, with the market attempting to shift from a bearish trend into a technical rebound.
However, the moving averages still maintain a bearish alignment, with MA5 < MA10 < MA20. Although the rebound has gained some momentum, a stable bullish trend has not yet been established.
Upside: Initial resistance is located at 4030–4040. If gold breaks above this zone and holds firmly on the 1-hour chart, the rebound could extend toward 4058–4060.
Downside: Key short-term support is located at 4020–4010. If this zone holds, the rebound may continue. However, if the price falls back below 4010, further downside toward 3993–3976 becomes possible.
✅ Trading Strategy
🔴 Sell on Rallies: Focus on the 4030–4040 resistance zone. If the price rebounds into this area but faces rejection and forms a bearish reversal candlestick on the 1-hour chart, consider opening short positions, targeting 4020 → 4003 → 3993.
If the price breaks above 4040 and holds firmly, abandon the short-selling setup in this zone and watch for potential resistance around 4058–4070.
🟢 Buy on Pullbacks: Watch the 4020–4010 support zone. If the price pulls back to this area, stabilizes, and shows clear bullish reversal signals, consider opening short-term long positions, targeting 4034 → 4040 → 4058.
👉 If you found this analysis helpful, please leave a like and share your thoughts in the comments!
❤️ Wishing you successful trading!
Trade active
📊 4-Hour Trend Analysis
Gold has recently broken below several key levels, including 4030 and 4000, reaching a low of 3965.18 before rebounding sharply toward 3995. The price is still trading below all three moving averages, with MA5 < MA10 < MA20 forming a bearish alignment, indicating that the overall downtrend on the 4-hour chart remains intact.
Notably, gold fell to 3965.18, significantly breaking below the 4-hour lower Bollinger Band at 3983.06, before quickly recovering back inside the bands. This suggests that buying interest has emerged at lower levels and that the market may be due for a technical recovery following the recent sustained decline.
📊 1-Hour Trend Analysis
On the 1-hour chart, gold had been trending downward with a clear pattern of lower lows. After falling to 3965.18, the price rebounded sharply, with the latest hourly candlestick forming a strong bullish candle.
The price has now moved back above MA5 and is testing MA10 (3995.20), but remains below MA20 (4007.46). This indicates that although short-term buying momentum has strengthened, the current upward movement is still considered a technical rebound within a broader bearish trend.
Upside: If gold achieves a decisive breakout and holds firmly above resistance on the 1-hour chart, it could move higher to test 4005–4008. A further breakout above 4008 could extend the rebound toward 4020–4032.
Downside: Initial support is located at 3988–3977. If the price pulls back into this zone and stabilizes, the short-term rebound may continue. However, if gold falls below 3977 again, it could retest 3970–3965.
✅ Trading Strategy
🔴 Sell on Rallies: Focus on the 4005–4015 resistance zone. If gold rebounds into this area but faces strong rejection and forms a bearish reversal candlestick on the 1-hour chart, consider opening short positions, targeting 3990 → 3977 → 3965.
If the price breaks decisively above 4008 and holds firmly, temporarily abandon the short-selling setup in this area and watch for potential resistance around 4025–4032.
🟢 Buy on Pullbacks: Watch the 3977–3965 support zone. If gold pulls back into this area without making a new low and shows clear bullish reversal signals, consider opening short-term long positions, targeting 3995 → 4008 → 4023 → 4032.

🏆 XAUUSD| Professional Gold Trading CLUB
✅ Real-time trading guidance
✅ 3–5 high-quality trading signals daily
✅ Potential daily profits of 500–1000 pips
✅ Strict risk management rules
🌐VIP Channel: t.me/+FpaizTnv2bRmNzk1
✅ Real-time trading guidance
✅ 3–5 high-quality trading signals daily
✅ Potential daily profits of 500–1000 pips
✅ Strict risk management rules
🌐VIP Channel: t.me/+FpaizTnv2bRmNzk1
Disclaimer
The information and publications are not meant to be, and do not constitute, financial, investment, trading, or other types of advice or recommendations supplied or endorsed by TradingView. Read more in the Terms of Use.
🏆 XAUUSD| Professional Gold Trading CLUB
✅ Real-time trading guidance
✅ 3–5 high-quality trading signals daily
✅ Potential daily profits of 500–1000 pips
✅ Strict risk management rules
🌐VIP Channel: t.me/+FpaizTnv2bRmNzk1
✅ Real-time trading guidance
✅ 3–5 high-quality trading signals daily
✅ Potential daily profits of 500–1000 pips
✅ Strict risk management rules
🌐VIP Channel: t.me/+FpaizTnv2bRmNzk1
Disclaimer
The information and publications are not meant to be, and do not constitute, financial, investment, trading, or other types of advice or recommendations supplied or endorsed by TradingView. Read more in the Terms of Use.