
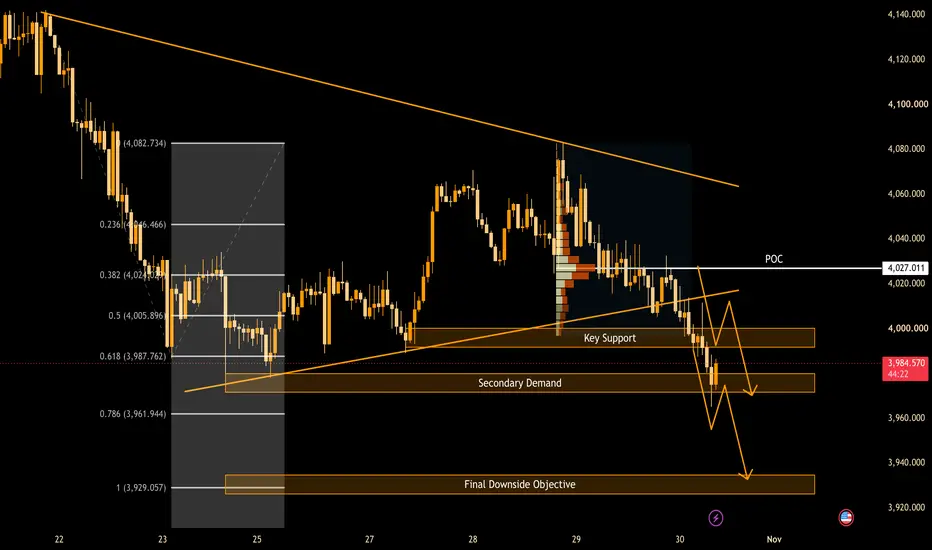
Gold has returned to a crucial support zone. After rejecting the downtrend line near 4080, the XAUUSD pair broke its uptrend line and fell below the Point of Control (POC) level on the volume chart, at 4027.011.
The price is currently testing the 3990-4000 zone. Will buyers be able to take advantage of the liquidity and reclaim the support, or are we witnessing the beginning of a new bearish wave?
Market Structure - Recovery Under Pressure
The recovery observed during the first half of the year, since the lows at the end of October, has not been sufficient to sustainably break above the downtrend line. The rejection near 4075-4080 was followed by weaker rebounds and renewed selling pressure.
The break of the ascending trendline indicates a weakening of the short-term bullish structure. The price has also fallen below the 4027.011 level, the Control Point (CP) on the chart, highlighting the potential for a failed retest.
The reference chart indicates that gold is trading around 3991.90, near the lower limit of immediate support. A break below this support level is not definitive confirmation, even though the price is currently trading below it; further monitoring and retesting are essential.
SMC/ICT Liquidity Chart
4027.011 | Control Point and Potential Resistance
This is the key support level following the breakout. A price rebound without a retest of the control point would strengthen the sellers' position.
3990–4000 | Key Support/Selling Liquidity
Immediate Decision Zone A rapid drop below recent lows, followed by a decline, could indicate a rejection of the lower price levels. Holding below this zone would suggest the continuation of the downward movement.
3970–3980 | Secondary Demand
The next demand zone is identified on the chart. A reaction is expected, not an automatic reversal: the bullish MSS indicator requires a clear structural breakout after the test.
3961.944 | Fibonacci Retracement Level: 0.786
A deeper correction level is anticipated if secondary demand does not hold.
3926–3935 | Ultimate Bearish Target
Extended bearish target for the chart, significant only if the lower support level is breached.
Bearish Scenario: Breakout, Retest, Extension
The preferred scenario follows the expected chart patterns:
Gold confirms its acceptance on the hourly timeframe below the 3,990–4,000 level.
Any bounce off the broken support level fails to materialize.
A bearish reversal or the MSS indicator on a shorter timeframe confirms continued selling pressure.
This sequence would highlight the 3,970–3,980 level. A strong break in secondary demand could expose the 3,961.944 level, and ultimately the 3,926–3,935 target zone.
A sharp decline is possible, but reacting immediately to the initial breakout point does not provide sufficient structural information, unlike anticipating a reaction after a retest.
The other bullish option: a consolidation followed by a rebound
Another explanation is possible: the price could accumulate selling pressure around the 3,990 level before reversing.
For this explanation to be credible, gold must reclaim the 4,000 level with a strong rally, establish a more stable intraday price structure, and test the control point at 4,027.011.
A sustained hourly rally above 4,027 would weaken the hypothesis of an immediate downward continuation. Until then, rebounds below this level remain fragile.
A rebound towards 4,005.896, the 0.5 Fibonacci level, would be an early indicator of buying interest. However, a stronger confirmation would require the price to break through the resistance zone between 4024 and 4027.
Market Analysis by Tyler
Gold is no longer simply approaching a support level; the market is testing the strength of the previous rally.
The chart suggests the potential for further declines, but the market still needs to prove its ability to accept a level below $3990 and not retest it.
Cash flow could reverse. A non-rebounded decline could continue.
How will gold react at the $3990-$4000 level?
This is a technical analysis, not a guarantee of results.
The price is currently testing the 3990-4000 zone. Will buyers be able to take advantage of the liquidity and reclaim the support, or are we witnessing the beginning of a new bearish wave?
Market Structure - Recovery Under Pressure
The recovery observed during the first half of the year, since the lows at the end of October, has not been sufficient to sustainably break above the downtrend line. The rejection near 4075-4080 was followed by weaker rebounds and renewed selling pressure.
The break of the ascending trendline indicates a weakening of the short-term bullish structure. The price has also fallen below the 4027.011 level, the Control Point (CP) on the chart, highlighting the potential for a failed retest.
The reference chart indicates that gold is trading around 3991.90, near the lower limit of immediate support. A break below this support level is not definitive confirmation, even though the price is currently trading below it; further monitoring and retesting are essential.
SMC/ICT Liquidity Chart
4027.011 | Control Point and Potential Resistance
This is the key support level following the breakout. A price rebound without a retest of the control point would strengthen the sellers' position.
3990–4000 | Key Support/Selling Liquidity
Immediate Decision Zone A rapid drop below recent lows, followed by a decline, could indicate a rejection of the lower price levels. Holding below this zone would suggest the continuation of the downward movement.
3970–3980 | Secondary Demand
The next demand zone is identified on the chart. A reaction is expected, not an automatic reversal: the bullish MSS indicator requires a clear structural breakout after the test.
3961.944 | Fibonacci Retracement Level: 0.786
A deeper correction level is anticipated if secondary demand does not hold.
3926–3935 | Ultimate Bearish Target
Extended bearish target for the chart, significant only if the lower support level is breached.
Bearish Scenario: Breakout, Retest, Extension
The preferred scenario follows the expected chart patterns:
Gold confirms its acceptance on the hourly timeframe below the 3,990–4,000 level.
Any bounce off the broken support level fails to materialize.
A bearish reversal or the MSS indicator on a shorter timeframe confirms continued selling pressure.
This sequence would highlight the 3,970–3,980 level. A strong break in secondary demand could expose the 3,961.944 level, and ultimately the 3,926–3,935 target zone.
A sharp decline is possible, but reacting immediately to the initial breakout point does not provide sufficient structural information, unlike anticipating a reaction after a retest.
The other bullish option: a consolidation followed by a rebound
Another explanation is possible: the price could accumulate selling pressure around the 3,990 level before reversing.
For this explanation to be credible, gold must reclaim the 4,000 level with a strong rally, establish a more stable intraday price structure, and test the control point at 4,027.011.
A sustained hourly rally above 4,027 would weaken the hypothesis of an immediate downward continuation. Until then, rebounds below this level remain fragile.
A rebound towards 4,005.896, the 0.5 Fibonacci level, would be an early indicator of buying interest. However, a stronger confirmation would require the price to break through the resistance zone between 4024 and 4027.
Market Analysis by Tyler
Gold is no longer simply approaching a support level; the market is testing the strength of the previous rally.
The chart suggests the potential for further declines, but the market still needs to prove its ability to accept a level below $3990 and not retest it.
Cash flow could reverse. A non-rebounded decline could continue.
How will gold react at the $3990-$4000 level?
This is a technical analysis, not a guarantee of results.
Trade closed: target reached
Price moved in the anticipated bearish direction, following the projected downside scenario. The market broke below Key Support and Secondary Demand, accelerating lower toward the Final Downside Objective around 3,929.057. The target was successfully reached, confirming the validity of the bearish setup and the projected price direction. With the downside objective achieved, this trading plan is now officially completed. No further action is required under this setup.

Related publications
Disclaimer
The information and publications are not meant to be, and do not constitute, financial, investment, trading, or other types of advice or recommendations supplied or endorsed by TradingView. Read more in the Terms of Use.
Related publications
Disclaimer
The information and publications are not meant to be, and do not constitute, financial, investment, trading, or other types of advice or recommendations supplied or endorsed by TradingView. Read more in the Terms of Use.