
The Logic of Mid-Term Rate Hikes Caps the Rebound; Any Rally in Gold Is a Prime Opportunity for Short Positions
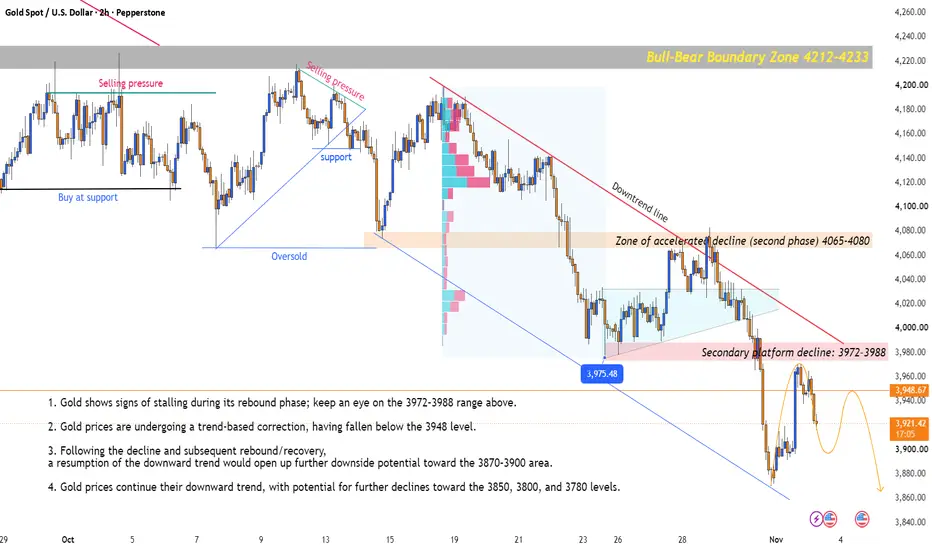
Looking at this 2-hour chart—where gold prices plummeted from above 4200 to around 3948—one gets the distinct impression of a "piling on" effect, as if everyone is rushing to push over a crumbling wall. While gold saw a corrective rebound today, fueled by easing geopolitical tensions and a collapse in oil prices, this is little more than a "dead cat bounce." Given the overarching reality—a greater than 75% probability of a Federal Reserve rate hike in December—any rally in gold should be viewed tactically as a rallying cry for the bears to regroup, rather than a sign of a trend reversal.
Fundamentals: The Double-Edged Sword of Cooling Energy Prices and the Specter of Rate Hikes
The dramatic easing of tensions in the Middle East yesterday became the market's primary variable. Signals of potential peace talks between the U.S. and Iran triggered a more than 7% single-day plunge in Brent crude. At first glance, the collapse in oil prices might appear bearish for gold by weakening the demand for an inflation hedge. However, the deeper implication is that falling energy costs have temporarily eased the Fed’s inflation anxieties, providing a breather for the U.S. dollar. More importantly, the hawkish chorus within the Federal Reserve remains undeterred; Dallas Fed President Lorie Logan has explicitly stated that "at least two more rate hikes" are likely needed. Furthermore, with the U.S. core PCE price index for September still running high at 3.1% year-on-year, and economic data showing continued resilience—such as the ISM manufacturing PMI rebounding to 55.5—the narrative of "higher for longer" interest rates is far from over. Additionally, the world’s largest gold ETF, SPDR, reduced its holdings by another 1.14 tonnes yesterday; the quiet withdrawal of institutional capital during this rebound is certainly not the hallmark of a bull market.
Technical Perspective: The Downward Trendline as a Sword of Damocles
The market’s own language is starkly clear. The red downward-sloping trend line, in place since mid-October, acts like a high-voltage electric fence, ruthlessly suppressing every counterattack by the bulls. Having broken below the previous "accelerated decline zone" of 4065–4080, the price of gold has effectively confirmed the bearish trend for a second time. Currently, the price is struggling near 3948. The 3972–3988 range—marked on the chart as a "secondary platform decline"—represents a former area of heavy volume (a key zone of accumulated positions) that has now flipped from support into formidable resistance. Unless the bulls can reclaim this zone with significant volume, any rebound is merely gathering energy for the next leg down. While the 3870–3900 zone below may exert a gravitational pull for an oversold bounce, a shift toward a more hawkish macroeconomic sentiment would likely make a breach of this level—leading to a test of 3850 or even 3800—only a matter of time.
Trading Strategy: Short the Rebounds, Stay Vigilant
Given my firm conviction in the overarching bearish trend, I will certainly not be "buying the dip" during this rebound. For intraday traders, waiting patiently for gold to rally into the 3972–3988 resistance zone offers an excellent risk-reward entry point for short positions. I recommend placing a stop-loss above the 4000 round-number mark. The initial target is the previous low at 3948; a break below this would open the path toward the 3900–3870 zone.
If the price drops toward the 3920 level today, one could look to initiate a short position, utilizing the 3948 level—now acting as resistance—as a reference point. Set your stop-loss above this resistance zone, and look for a breakdown below 3900, with further targets at 3880–3850.
Trading is never about who can move the fastest; it is about who can survive the longest. Given the current macroeconomic headwinds and the bearish technical setup, following the trend—even by shorting into a rebound—is far safer than attempting to guess a bottom against the prevailing momentum. Keep a close eye on that red trend line above; as long as it holds, the bears remain in the dark—their day has yet to dawn.
💡 Developing a sound logical framework requires real effort. If you find this in-depth analysis insightful for your own trading, please show your support by hitting the "Like" button and following me.
I will continue to break down the latest tug-of-war between bulls and bears in the gold market, helping you become a clear-headed "trend-following hunter" in this arena! Happy trading, everyone! 🚀
Looking at this 2-hour chart—where gold prices plummeted from above 4200 to around 3948—one gets the distinct impression of a "piling on" effect, as if everyone is rushing to push over a crumbling wall. While gold saw a corrective rebound today, fueled by easing geopolitical tensions and a collapse in oil prices, this is little more than a "dead cat bounce." Given the overarching reality—a greater than 75% probability of a Federal Reserve rate hike in December—any rally in gold should be viewed tactically as a rallying cry for the bears to regroup, rather than a sign of a trend reversal.
Fundamentals: The Double-Edged Sword of Cooling Energy Prices and the Specter of Rate Hikes
The dramatic easing of tensions in the Middle East yesterday became the market's primary variable. Signals of potential peace talks between the U.S. and Iran triggered a more than 7% single-day plunge in Brent crude. At first glance, the collapse in oil prices might appear bearish for gold by weakening the demand for an inflation hedge. However, the deeper implication is that falling energy costs have temporarily eased the Fed’s inflation anxieties, providing a breather for the U.S. dollar. More importantly, the hawkish chorus within the Federal Reserve remains undeterred; Dallas Fed President Lorie Logan has explicitly stated that "at least two more rate hikes" are likely needed. Furthermore, with the U.S. core PCE price index for September still running high at 3.1% year-on-year, and economic data showing continued resilience—such as the ISM manufacturing PMI rebounding to 55.5—the narrative of "higher for longer" interest rates is far from over. Additionally, the world’s largest gold ETF, SPDR, reduced its holdings by another 1.14 tonnes yesterday; the quiet withdrawal of institutional capital during this rebound is certainly not the hallmark of a bull market.
Technical Perspective: The Downward Trendline as a Sword of Damocles
The market’s own language is starkly clear. The red downward-sloping trend line, in place since mid-October, acts like a high-voltage electric fence, ruthlessly suppressing every counterattack by the bulls. Having broken below the previous "accelerated decline zone" of 4065–4080, the price of gold has effectively confirmed the bearish trend for a second time. Currently, the price is struggling near 3948. The 3972–3988 range—marked on the chart as a "secondary platform decline"—represents a former area of heavy volume (a key zone of accumulated positions) that has now flipped from support into formidable resistance. Unless the bulls can reclaim this zone with significant volume, any rebound is merely gathering energy for the next leg down. While the 3870–3900 zone below may exert a gravitational pull for an oversold bounce, a shift toward a more hawkish macroeconomic sentiment would likely make a breach of this level—leading to a test of 3850 or even 3800—only a matter of time.
Trading Strategy: Short the Rebounds, Stay Vigilant
Given my firm conviction in the overarching bearish trend, I will certainly not be "buying the dip" during this rebound. For intraday traders, waiting patiently for gold to rally into the 3972–3988 resistance zone offers an excellent risk-reward entry point for short positions. I recommend placing a stop-loss above the 4000 round-number mark. The initial target is the previous low at 3948; a break below this would open the path toward the 3900–3870 zone.
If the price drops toward the 3920 level today, one could look to initiate a short position, utilizing the 3948 level—now acting as resistance—as a reference point. Set your stop-loss above this resistance zone, and look for a breakdown below 3900, with further targets at 3880–3850.
Trading is never about who can move the fastest; it is about who can survive the longest. Given the current macroeconomic headwinds and the bearish technical setup, following the trend—even by shorting into a rebound—is far safer than attempting to guess a bottom against the prevailing momentum. Keep a close eye on that red trend line above; as long as it holds, the bears remain in the dark—their day has yet to dawn.
💡 Developing a sound logical framework requires real effort. If you find this in-depth analysis insightful for your own trading, please show your support by hitting the "Like" button and following me.
I will continue to break down the latest tug-of-war between bulls and bears in the gold market, helping you become a clear-headed "trend-following hunter" in this arena! Happy trading, everyone! 🚀
Trade active
Gold’s corrective rebound fails to alter its underlying weakness; maintain a bearish bias by selling into rallies within a converging downward structure.
Yesterday’s rally from the bottom of the channel proved to be nothing more than a "flash in the pan." After a hopeful test of the previous resistance zone between 3972 and 3988, the price was ruthlessly driven back down by the bears. Following a period of oscillation and a gradual decline during the Asian and European sessions, gold has now retreated to the support level near 3895. This pattern—characterized by a series of lower highs—is a hallmark of weakness; do not be misled by short-term rebounds.
Technical Outlook: A Converging Downward Structure Has Formed
Bulls and bears are currently battling within a narrow range of 3895–3910, which serves as the critical short-term pivot point for today:
A breakout above this range could lead to a test of the 3925 and 3948 levels.
A breakdown below this range would likely lead directly to tests of 3870 and 3850.
Looking beyond the short term, the market displays a converging downward structure with progressively lower highs. The upside is heavily congested with resistance; even if the price breaks above 3910 or rallies toward 3948, it would not signal a reversal, but rather provide an ideal "sniper point" for the bears. The broader trend remains firmly under the control of the bears.
Today’s Strategy: Long, then Short—Prioritize Selling into Rallies
Given the logic that the primary trend is bearish while short-term corrective rebounds are possible, the tactical approach is clear: participate in the corrective rebound first, then position for the broader bearish trend.
Short-term Longs: Relying on the 3895–3910 support zone, one may enter a light long position if the price pulls back but holds above 3895. Targets are 3925–3930, with a stop-loss placed below 3890. This is strictly for capturing a rebound—take profits promptly and do not overstay the position.
Primary Focus on Shorts: As the price rebounds, the resistance overhead increases exponentially. Keep a close eye on the 3948 level. If you see signs of stalling—such as a failure to push higher or the formation of a long upper wick—it presents an excellent opportunity to go short. Look for targets at 3900, 3870, or even lower. Even if the price manages to break above this level, it will face significant overhead resistance, and the broader downward trend will eventually reassert itself.
Avoid indecision in your trading. Once you’ve identified a converging downward structure, treat any long positions strictly as short-term plays. The real profit potential lies in positioning for shorts at higher levels, allowing you to ride the prevailing trend.
💡 If you found this analysis insightful, please show your support with a [Like]!
[Follow] me for ongoing, in-depth breakdowns of the gold market—helping you capture consistent profits! Happy trading, everyone! 🚀
Trade closed: target reached
Gold faced resistance and pulled back precisely at the 3968 level; the bearish structure remains intact—what’s next?
Market movements follow their own internal logic. As previously noted, any short-term corrective rebound would encounter significant overhead resistance. Today, the price reached a high of 3968 before facing selling pressure and pulling back. This confirms that the prevailing "converging downward structure"—characterized by progressively lower highs—remains firmly in play. Heavy selling pressure persists, and the overarching bearish trend remains unchanged.
With the price now pulling back, we must closely monitor the narrow support zone between 3895 and 3910. A break below 3895 would signal that the rebound momentum has exhausted, potentially opening the door for further declines toward 3870 and 3850. If the price stabilizes here, we may see some short-term fluctuations; however, as long as it fails to decisively break above the 3968 high, the overall weak trend will persist.
The core logic remains: within this converging downward structure, overhead resistance is substantial. Even if the price attempts another rebound, it will inevitably encounter significant resistance, likely leading it back into the downward trend. Our trading approach remains focused on selling into rebounds—trading in line with the prevailing trend.
🎯 Trading Strategy: Prioritize Short Positions; Consider Longs Only for Short-Term Scalps
Aggressive Traders (Selling into Rebounds): If the price rebounds to the 3968–3972 zone and faces resistance, consider entering short positions in stages. Place your stop-loss above 3990. Target the 3900 area first, with a potential move toward 3870 if that level breaks.
Conservative Traders (Selling on a Break): Wait patiently for a decisive break below the 3948 support level. Once the breakdown is confirmed (potentially following a minor retest), enter short positions. Look toward the 3820 or even 3800 area.
Short-Term Longs (Scalping Only): Consider a light-position long only if the price shows signs of stabilizing near 3895. Aim for a gain of $20–$30, and ensure a quick exit—do not overstay your welcome in the trade. The market structure has already signaled a direction; those who trade with the trend hold the initiative, while those who go against it often find themselves in a vulnerable position. My strategic analysis is rooted in logic, with every breakdown based on the objective movements of the market.
💡 Crafting original analysis takes effort—if you find the logic clear and helpful for your own trading, please show your support with a "Like"!
Hit "Follow" so you don’t miss any updates! I will continue to break down the gold market for you, helping you navigate the tug-of-war between bulls and bears and stay sharp in this volatile, unpredictable market. Wishing you all successful trades! 🚀

💎 Free Trading Signals:
t.me/+wLfC3Bk_plZlMmEx
💎 Trend Analysis & Setup Planning
💎 Market Structure Shifts & Pattern Analysis
-------------------------
❤️ One-on-one guidance:
t.me/ElinaXau
t.me/+wLfC3Bk_plZlMmEx
💎 Trend Analysis & Setup Planning
💎 Market Structure Shifts & Pattern Analysis
-------------------------
❤️ One-on-one guidance:
t.me/ElinaXau
Disclaimer
The information and publications are not meant to be, and do not constitute, financial, investment, trading, or other types of advice or recommendations supplied or endorsed by TradingView. Read more in the Terms of Use.
💎 Free Trading Signals:
t.me/+wLfC3Bk_plZlMmEx
💎 Trend Analysis & Setup Planning
💎 Market Structure Shifts & Pattern Analysis
-------------------------
❤️ One-on-one guidance:
t.me/ElinaXau
t.me/+wLfC3Bk_plZlMmEx
💎 Trend Analysis & Setup Planning
💎 Market Structure Shifts & Pattern Analysis
-------------------------
❤️ One-on-one guidance:
t.me/ElinaXau
Disclaimer
The information and publications are not meant to be, and do not constitute, financial, investment, trading, or other types of advice or recommendations supplied or endorsed by TradingView. Read more in the Terms of Use.