
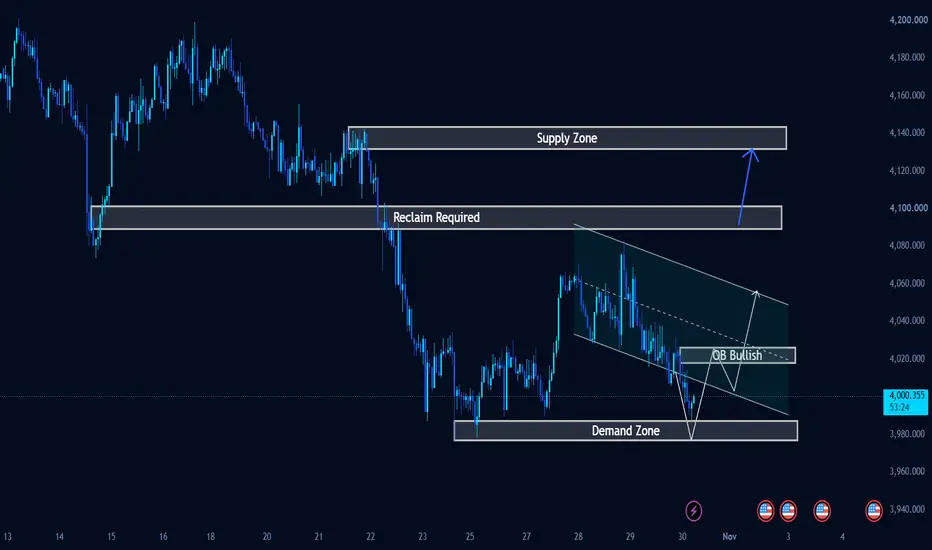
Gold has slipped below 4,000 after losing its recent recovery structure. A marked demand zone is now approaching, but buyers still need to demonstrate that they can turn a reaction into a sustainable recovery.
The next bounce will matter most if it changes the sequence of lower highs.
Market Structure — Sellers Regain the Initiative
The H1 recovery has given way to a descending channel, with lower highs and renewed downside pressure.
Price has also broken beneath the approximately 4,017–4,025 zone previously marked “OB Bullish.” That area now needs to be reclaimed before it can function as reliable support again.
Gold trades at 3,996.555 in this chart snapshot, just above the lower demand zone.
The immediate structure remains bearish. The projected bullish path represents a possible response from demand, not a confirmed reversal.
Key Zones — The Recovery Has Several Tests
Zone boundaries are approximate readings from the chart.
• 3,976–3,987 — Immediate demand zone and the foundation of the projected rebound.
• 4,017–4,025 — Broken support and the first meaningful reclaim test.
• 4,088–4,100 — Major overhead resistance, explicitly marked “Reclaim Required.”
• 4,131–4,143 — Upper supply zone, relevant only if the recovery clears the intervening resistance.
The descending channel’s upper boundary provides an additional dynamic resistance test before the major reclaim zone.
Primary Scenario — Demand Reaction, Then Structural Repair.
The drawn plan allows for a deeper test of demand before a recovery toward 4,017–4,025.
A rejection from demand would be an initial response. Stronger confirmation would require an H1 reclaim of broken support, followed by a pullback that establishes a higher low.
The projected retracement toward the 4,000 area must therefore prove itself through price action; the drawing alone does not establish support.
If buyers preserve that higher low, a further advance toward the channel’s upper boundary becomes more plausible.
A sustained channel breakout would improve the outlook, but 4,088–4,100 remains a separate hurdle. Only a successful reclaim and retest of that zone would strengthen the extension scenario toward 4,131–4,143.
Alternative Scenario — Demand Fails to Change the Trend
If a bounce stalls beneath 4,017–4,025 and forms another lower high, sellers retain the structural advantage.
An H1 close below demand, followed by a failed reclaim, would invalidate the proposed rebound from this zone and increase the risk of further downside.
No deeper horizontal target is marked on this chart, so I would reassess the next structure rather than invent one.
The Lesson Behind the Setup
A zone’s role depends on how price behaves around it.
The area marked bullish support has now been broken. Its label does not override that evidence: buyers must reclaim it and defend the next pullback.
What I’m Watching Next
First, the response inside demand. Then, whether buyers can recover 4,017–4,025 and build a higher low.
Would a demand reaction be enough for your analysis, or would you wait for broken support to be reclaimed?
The next bounce will matter most if it changes the sequence of lower highs.
Market Structure — Sellers Regain the Initiative
The H1 recovery has given way to a descending channel, with lower highs and renewed downside pressure.
Price has also broken beneath the approximately 4,017–4,025 zone previously marked “OB Bullish.” That area now needs to be reclaimed before it can function as reliable support again.
Gold trades at 3,996.555 in this chart snapshot, just above the lower demand zone.
The immediate structure remains bearish. The projected bullish path represents a possible response from demand, not a confirmed reversal.
Key Zones — The Recovery Has Several Tests
Zone boundaries are approximate readings from the chart.
• 3,976–3,987 — Immediate demand zone and the foundation of the projected rebound.
• 4,017–4,025 — Broken support and the first meaningful reclaim test.
• 4,088–4,100 — Major overhead resistance, explicitly marked “Reclaim Required.”
• 4,131–4,143 — Upper supply zone, relevant only if the recovery clears the intervening resistance.
The descending channel’s upper boundary provides an additional dynamic resistance test before the major reclaim zone.
Primary Scenario — Demand Reaction, Then Structural Repair.
The drawn plan allows for a deeper test of demand before a recovery toward 4,017–4,025.
A rejection from demand would be an initial response. Stronger confirmation would require an H1 reclaim of broken support, followed by a pullback that establishes a higher low.
The projected retracement toward the 4,000 area must therefore prove itself through price action; the drawing alone does not establish support.
If buyers preserve that higher low, a further advance toward the channel’s upper boundary becomes more plausible.
A sustained channel breakout would improve the outlook, but 4,088–4,100 remains a separate hurdle. Only a successful reclaim and retest of that zone would strengthen the extension scenario toward 4,131–4,143.
Alternative Scenario — Demand Fails to Change the Trend
If a bounce stalls beneath 4,017–4,025 and forms another lower high, sellers retain the structural advantage.
An H1 close below demand, followed by a failed reclaim, would invalidate the proposed rebound from this zone and increase the risk of further downside.
No deeper horizontal target is marked on this chart, so I would reassess the next structure rather than invent one.
The Lesson Behind the Setup
A zone’s role depends on how price behaves around it.
The area marked bullish support has now been broken. Its label does not override that evidence: buyers must reclaim it and defend the next pullback.
What I’m Watching Next
First, the response inside demand. Then, whether buyers can recover 4,017–4,025 and build a higher low.
Would a demand reaction be enough for your analysis, or would you wait for broken support to be reclaimed?
Trade closed manually
Gold moved lower as bearish momentum accelerated, breaking below the descending channel and losing the key Demand Zone around 4,000–3,980. The anticipated recovery scenario toward the 4,020 resistance area did not materialize, as sellers maintained control and pushed price further down. This plan is now closed manually. Going forward, attention shifts to potential price stabilization, the reaction around lower support levels, and whether buyers can regain momentum before any meaningful recovery develops.

Related publications
Disclaimer
The information and publications are not meant to be, and do not constitute, financial, investment, trading, or other types of advice or recommendations supplied or endorsed by TradingView. Read more in the Terms of Use.
Related publications
Disclaimer
The information and publications are not meant to be, and do not constitute, financial, investment, trading, or other types of advice or recommendations supplied or endorsed by TradingView. Read more in the Terms of Use.