
A rebound structure has taken shape; for intraday trading, the p
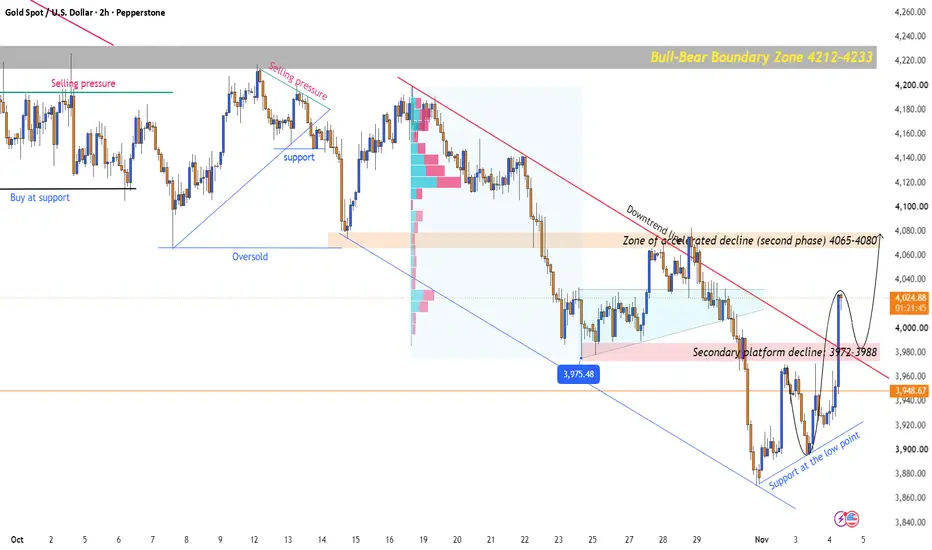
A rebound structure has taken shape; for intraday trading, the primary strategy is to "go long on a pullback following a breakout." The broader, long-term bearish trend remains intact, meaning any rebound should be viewed as a corrective move.
Fundamentals: Market sentiment is navigating a complex, contradictory landscape.
The Federal Reserve held rates steady in October, yet internal hawkish divisions have widened significantly—Dallas Fed President Lorie Logan even explicitly stated that "at least two more rate hikes" are needed. According to CME data, the probability of a rate hike in December remains above 78%. Meanwhile, U.S. Treasury yields rose across the board overnight, with the 10-year yield approaching 4.97%. Under normal market conditions, this macroeconomic backdrop should have pushed gold prices sharply lower—yet, the market has defied this expectation.
The U.S. Dollar Index (DXY) rose only marginally by 0.15% to close at 101.87, failing to track the rise in yields. More importantly, with the U.S. midterm elections underway—and the Democratic Party securing a key seat in the Senate—the market has begun to price in the political risk that a potential Trump administration could face significant checks on its power. Chris Weston, Head of Research at Pepperstone, put it plainly: a weaker dollar and declining Treasury yields have provided support for gold, while demand for a hedge against a "more confrontational Trump administration" is fueling buying interest.
This creates a nuanced fundamental setup: while macroeconomic expectations for monetary tightening weigh on the primary trend, short-term political uncertainty and a softer dollar have opened a window for a rebound.
Data from the World Gold Council is also telling: global central banks purchased a net 321 tonnes of gold in the third quarter—a 42% year-on-year increase and the highest level in a year. While institutions continue to buy for the long term, short-term prices have been battered by liquidity shocks and rate-hike expectations. This divergence is precisely the kind of environment where a rebound can emerge within a broader bearish trend.
Technical Perspective: The charts tell the story—local lows are beginning to shift upward.
Looking at the 2-hour chart you provided, the technical signals offer a more candid picture than the fundamentals.
First, the downward trendline is currently being tested. The red downward-sloping trend line, in place since mid-October, currently acts as resistance in the 3972–3988 range—the very area marked on the chart as the "secondary platform decline." During today’s European session, the price of gold climbed above $3,970/oz, indicating that the price is currently testing, or perhaps even tentatively breaking through, this trend line.
Second, the structure of the lows is improving. While the chart identifies 3975.48 as the absolute low, the blue arrow highlights a clear "break-below-and-rebound" pattern: after finding support near 3890 (a level extending from a previous low on the left), the price rallied quickly back above 3930 and has continued its rebound today. Observations from EFSG confirm this: although gold dipped to a low of 3895.37, it ultimately closed firmly above the 5-day SMA, signaling solid buying interest at lower levels. Furthermore, while the MACD remains in negative territory, the gap is narrowing.
Third, key levels are well-defined. To the upside, the initial resistance zone lies between 3972 and 3988 (the confluence of the downward trend line and a previous platform); a breakout here would open the path toward 4020–4060 (the lower boundary of the "zone of accelerated decline" shown on the chart). On the downside, the 3910–3930 range serves as a short-term pivot point between bulls and bears, while 3890 acts as the "lifeline" for this current rebound.
Today’s Strategy: Play the rebound breakout; look to go long on pullbacks.
Strategic Rationale: A bearish long-term outlook does not necessitate chasing the downside today. The chart suggests that bearish momentum exhausted itself near 3890, while fundamental factors—such as a weakening US dollar and political safe-haven demand—are providing short-term catalysts. It is more prudent today to trade in line with the current rebound momentum rather than attempting to pick a top against the prevailing short-term trend.
Execution Framework:
Entry Criteria: Wait for a definitive breakout and stabilization above the 3972–3988 zone (confirmed by a 2-hour candle close). Chasing the price higher immediately would result in an excessively large stop-loss, offering a poor risk-to-reward ratio. A better approach is to wait for a pullback to confirm the breakout—if the price rallies and then pulls back toward the 3972 level without breaking below it, that serves as an entry point.
Targets: The first target is 4020 (the resistance marked by the orange dashed line on the chart), and the second target is 4060 (the area where the previous accelerated decline began). Upon reaching 4020, close half of the position and move the stop-loss for the remaining portion to a break-even or protective level.
Stop-loss: Place it below 3930 (near the 5-day SMA and a short-term support zone). If the price falls back below 3930, it indicates that the rebound structure has been invalidated, and long positions must be exited.
Position Sizing: Keep positions light. This is a counter-trend rebound trade, not a trend-following trade. Given the overall bearish trend, the rebound could be cut short at any moment by negative macroeconomic developments (such as tonight’s ADP or ISM data coming in stronger than expected); therefore, position management is more critical than predicting the direction.
Personal Perspective: Respect the bears, but don’t overlook the "resistance."
To be honest, going long on gold at this level doesn't feel entirely comfortable. With the Federal Reserve’s hawkish stance still ringing in our ears—and an 80% probability of a rate hike in December—any strong employment data could instantly send the price of gold back below 3900. I have no doubt that the broader trend remains bearish.
However, trading is not simply a game of "getting the direction right." The charts suggest that the bears are struggling to push the price lower in the 3890–3900 zone, while the US Dollar is showing signs of fatigue amid the uncertainty surrounding the midterm elections. In such moments, respecting the market’s short-term choices is more practical than stubbornly clinging to a macro-narrative.
The keyword for today is "breakout"—specifically, a confirmed breakout above the downward trend line. If the 3972–3988 range is decisively cleared, it opens up room for a rebound; if the price rallies only to fall back, then it’s best to revert to a bearish outlook and wait for the next short-selling signal.
Market conditions change in an instant. A strategy is merely a framework; a trader’s true skill lies in their ability to adapt in real-time. If you found today’s analysis helpful, please consider hitting the "like" button and following the channel—every bit of engagement motivates me to keep producing in-depth market reviews. I’d also love to hear your thoughts on the future outlook for gold; let’s exchange ideas and refine our trading logic together. The market is never short of opportunities—what’s often missing is someone to help you see the bigger picture. Like, follow, and I’ll see you in the comments! 👇
Fundamentals: Market sentiment is navigating a complex, contradictory landscape.
The Federal Reserve held rates steady in October, yet internal hawkish divisions have widened significantly—Dallas Fed President Lorie Logan even explicitly stated that "at least two more rate hikes" are needed. According to CME data, the probability of a rate hike in December remains above 78%. Meanwhile, U.S. Treasury yields rose across the board overnight, with the 10-year yield approaching 4.97%. Under normal market conditions, this macroeconomic backdrop should have pushed gold prices sharply lower—yet, the market has defied this expectation.
The U.S. Dollar Index (DXY) rose only marginally by 0.15% to close at 101.87, failing to track the rise in yields. More importantly, with the U.S. midterm elections underway—and the Democratic Party securing a key seat in the Senate—the market has begun to price in the political risk that a potential Trump administration could face significant checks on its power. Chris Weston, Head of Research at Pepperstone, put it plainly: a weaker dollar and declining Treasury yields have provided support for gold, while demand for a hedge against a "more confrontational Trump administration" is fueling buying interest.
This creates a nuanced fundamental setup: while macroeconomic expectations for monetary tightening weigh on the primary trend, short-term political uncertainty and a softer dollar have opened a window for a rebound.
Data from the World Gold Council is also telling: global central banks purchased a net 321 tonnes of gold in the third quarter—a 42% year-on-year increase and the highest level in a year. While institutions continue to buy for the long term, short-term prices have been battered by liquidity shocks and rate-hike expectations. This divergence is precisely the kind of environment where a rebound can emerge within a broader bearish trend.
Technical Perspective: The charts tell the story—local lows are beginning to shift upward.
Looking at the 2-hour chart you provided, the technical signals offer a more candid picture than the fundamentals.
First, the downward trendline is currently being tested. The red downward-sloping trend line, in place since mid-October, currently acts as resistance in the 3972–3988 range—the very area marked on the chart as the "secondary platform decline." During today’s European session, the price of gold climbed above $3,970/oz, indicating that the price is currently testing, or perhaps even tentatively breaking through, this trend line.
Second, the structure of the lows is improving. While the chart identifies 3975.48 as the absolute low, the blue arrow highlights a clear "break-below-and-rebound" pattern: after finding support near 3890 (a level extending from a previous low on the left), the price rallied quickly back above 3930 and has continued its rebound today. Observations from EFSG confirm this: although gold dipped to a low of 3895.37, it ultimately closed firmly above the 5-day SMA, signaling solid buying interest at lower levels. Furthermore, while the MACD remains in negative territory, the gap is narrowing.
Third, key levels are well-defined. To the upside, the initial resistance zone lies between 3972 and 3988 (the confluence of the downward trend line and a previous platform); a breakout here would open the path toward 4020–4060 (the lower boundary of the "zone of accelerated decline" shown on the chart). On the downside, the 3910–3930 range serves as a short-term pivot point between bulls and bears, while 3890 acts as the "lifeline" for this current rebound.
Today’s Strategy: Play the rebound breakout; look to go long on pullbacks.
Strategic Rationale: A bearish long-term outlook does not necessitate chasing the downside today. The chart suggests that bearish momentum exhausted itself near 3890, while fundamental factors—such as a weakening US dollar and political safe-haven demand—are providing short-term catalysts. It is more prudent today to trade in line with the current rebound momentum rather than attempting to pick a top against the prevailing short-term trend.
Execution Framework:
Entry Criteria: Wait for a definitive breakout and stabilization above the 3972–3988 zone (confirmed by a 2-hour candle close). Chasing the price higher immediately would result in an excessively large stop-loss, offering a poor risk-to-reward ratio. A better approach is to wait for a pullback to confirm the breakout—if the price rallies and then pulls back toward the 3972 level without breaking below it, that serves as an entry point.
Targets: The first target is 4020 (the resistance marked by the orange dashed line on the chart), and the second target is 4060 (the area where the previous accelerated decline began). Upon reaching 4020, close half of the position and move the stop-loss for the remaining portion to a break-even or protective level.
Stop-loss: Place it below 3930 (near the 5-day SMA and a short-term support zone). If the price falls back below 3930, it indicates that the rebound structure has been invalidated, and long positions must be exited.
Position Sizing: Keep positions light. This is a counter-trend rebound trade, not a trend-following trade. Given the overall bearish trend, the rebound could be cut short at any moment by negative macroeconomic developments (such as tonight’s ADP or ISM data coming in stronger than expected); therefore, position management is more critical than predicting the direction.
Personal Perspective: Respect the bears, but don’t overlook the "resistance."
To be honest, going long on gold at this level doesn't feel entirely comfortable. With the Federal Reserve’s hawkish stance still ringing in our ears—and an 80% probability of a rate hike in December—any strong employment data could instantly send the price of gold back below 3900. I have no doubt that the broader trend remains bearish.
However, trading is not simply a game of "getting the direction right." The charts suggest that the bears are struggling to push the price lower in the 3890–3900 zone, while the US Dollar is showing signs of fatigue amid the uncertainty surrounding the midterm elections. In such moments, respecting the market’s short-term choices is more practical than stubbornly clinging to a macro-narrative.
The keyword for today is "breakout"—specifically, a confirmed breakout above the downward trend line. If the 3972–3988 range is decisively cleared, it opens up room for a rebound; if the price rallies only to fall back, then it’s best to revert to a bearish outlook and wait for the next short-selling signal.
Market conditions change in an instant. A strategy is merely a framework; a trader’s true skill lies in their ability to adapt in real-time. If you found today’s analysis helpful, please consider hitting the "like" button and following the channel—every bit of engagement motivates me to keep producing in-depth market reviews. I’d also love to hear your thoughts on the future outlook for gold; let’s exchange ideas and refine our trading logic together. The market is never short of opportunities—what’s often missing is someone to help you see the bigger picture. Like, follow, and I’ll see you in the comments! 👇
Trade active
The downward channel for gold has been broken, and an "ascending triangle" breakout has been confirmed. For today, the strategy is "short first, then long"—wait patiently for a pullback.
Technical Overview
Channel Breakout: The price has surged, decisively breaking through the previous downward channel; short-term bullish momentum is now dominant.
Pattern Confirmation: An "ascending triangle" breakout has formed, signaling that the accumulated bullish energy has been unleashed.
Key Transition Zone: The 3972–3988 range has shifted from resistance to support, serving as a critical pivot point for market sentiment.
Upside Resistance: Two Key Levels
Near 4040: The first layer of short-term selling pressure; a primary area to consider for potential short positions.
4060–4065 Zone: A more significant resistance zone, marking the origin of a previous accelerated decline. A firm breakout here would open up further upside, while rejection would halt the short-term bullish momentum.
Today’s Strategy: Short First, Then Long
Logic: While the breakout is confirmed, the rapid surge suggests a need for a pullback. Look to play a short-term retracement from the resistance zone, then re-enter with a long position once the pullback finds support. This is a tactical, rhythm-based approach, not a bet on a full-scale trend reversal.
Phase 1: Light-Position Short at the Resistance Zone
Entry: If the price reaches the 4040 area and shows signs of stalling (e.g., long upper wicks, bearish engulfing patterns, or structural breakdown), consider a light-position short. The 4060–4065 zone serves as an even better area to monitor for potential entry if the price fails to hold above it.
Target: Look for a pullback toward 3990–3988.
Stop-Loss: Place above 4070. If the price establishes a firm position above 4065, exit the trade—do not overstay. Phase 2: Pullback to Support – Turning Bullish (Primary Focus)
Entry: Look for a pullback to test the 3972–3988 range, followed by signs of stabilization (e.g., long lower wicks, a double bottom, or a 2-hour candle close that holds above this level).
Targets: 4040 → 4060–4065; a strong breakout above 4065 opens the door for further gains.
Stop-Loss: Below 3940. If the price breaks decisively below 3972, the bullish thesis must be re-evaluated.
Position Sizing: Keep short positions light and short-term, with strict stop-losses. For long positions, consider increasing size once the pullback is confirmed. Avoid holding short positions as if they were long-term trend trades, and refrain from "bottom-fishing" (buying in too early) before a clear entry signal appears.
Personal Perspective
The breakout has bolstered the bulls, but chasing highs is not the same as trading a breakout. Levels like 4040 and 4060–4065 are significant; the first pullback following a sharp rally often presents the most "lucrative" entry point. By looking to short first and then go long, you are essentially trading patience for a better risk-to-reward ratio—don’t predict, simply follow the market, wait for the signal, and then pull the trigger.
📌 Market conditions shift rapidly; strategies are merely frameworks, and real skill lies in how you adapt in real-time. If you found this helpful, please like and follow—your engagement keeps me motivated to continue producing in-depth market analysis.
Trade closed: target reached
Gold faces resistance at 4050, pulling back to 4030; short-term price action enters a consolidation phase.
In our morning update, we outlined a "short first, then long" strategy—a sequence that is currently playing out exactly as analyzed. Gold climbed toward 4050, encountered resistance twice, and subsequently pulled back to 4030. This initial rejection at the resistance zone aligns perfectly with our forecast.
📊 How to interpret the current market setup?
Two failed attempts at 4050: The formation of a short-term "double top" indicates genuine selling pressure below the 4060–4065 range, signaling that the bulls’ first attempt to break through has been thwarted.
Pullback to 4030: This is a standard technical retest following a breakout. The support zone at 3972–3988 remains intact, and the overall bullish/bearish sentiment balance has not been compromised.
Conclusion: The market has entered a short-term consolidation phase. Avoid chasing shorts here; instead, shift focus toward identifying a stabilization point for the next leg of the bullish move.
🎯 What’s the plan? (The initial resistance phase has played out; now, look for long opportunities.)
Next move: Go long following a retest of support.
Entry: Watch for a pullback to the 3972–3988 support zone. Once signs of stabilization appear—such as long lower wicks, a "double bottom" pattern, or a 2-hour candle closing firmly above support—begin scaling into long positions. Alternatively, if the price stops falling early (e.g., in the 4010–4020 range), you may consider a small, speculative long position.
Targets: Look for a rebound toward 4040, followed by 4060–4065. A strong breakout above 4065 would open the door for further upside.
Stop-loss: Place below 3940. If the price breaks decisively below 3972, the bullish thesis must be re-evaluated—do not hold onto losing long positions.
Position Sizing: Increase exposure only after the support level is confirmed. Avoid "bottom-fishing" too early, and do not treat short positions as if they are part of a long-term trend. 💡 Personal Perspective:
The two failed attempts to push past the 4050 level don’t mean the bulls have run out of steam; rather, the initial retreat should be viewed as a "probing pullback" before a true breakout. A retest following a breakout often provides the most favorable entry point. With the expected resistance-driven pullback already playing out, the current strategy is to wait patiently for the price to stabilize—that’s your cue to pull the trigger on a long position. The core rhythm for today remains: look to go short first, then long—trading patience for a better risk-to-reward ratio.
📌 If you find this kind of forward-looking analysis and precise timing helpful, please hit "like" and follow! Feel free to share your own trading ideas in the comments section as well.

💎 Free Trading Signals:
t.me/+wLfC3Bk_plZlMmEx
💎 Trend Analysis & Setup Planning
💎 Market Structure Shifts & Pattern Analysis
-------------------------
❤️ One-on-one guidance:
t.me/ElinaXau
t.me/+wLfC3Bk_plZlMmEx
💎 Trend Analysis & Setup Planning
💎 Market Structure Shifts & Pattern Analysis
-------------------------
❤️ One-on-one guidance:
t.me/ElinaXau
Disclaimer
The information and publications are not meant to be, and do not constitute, financial, investment, trading, or other types of advice or recommendations supplied or endorsed by TradingView. Read more in the Terms of Use.
💎 Free Trading Signals:
t.me/+wLfC3Bk_plZlMmEx
💎 Trend Analysis & Setup Planning
💎 Market Structure Shifts & Pattern Analysis
-------------------------
❤️ One-on-one guidance:
t.me/ElinaXau
t.me/+wLfC3Bk_plZlMmEx
💎 Trend Analysis & Setup Planning
💎 Market Structure Shifts & Pattern Analysis
-------------------------
❤️ One-on-one guidance:
t.me/ElinaXau
Disclaimer
The information and publications are not meant to be, and do not constitute, financial, investment, trading, or other types of advice or recommendations supplied or endorsed by TradingView. Read more in the Terms of Use.