
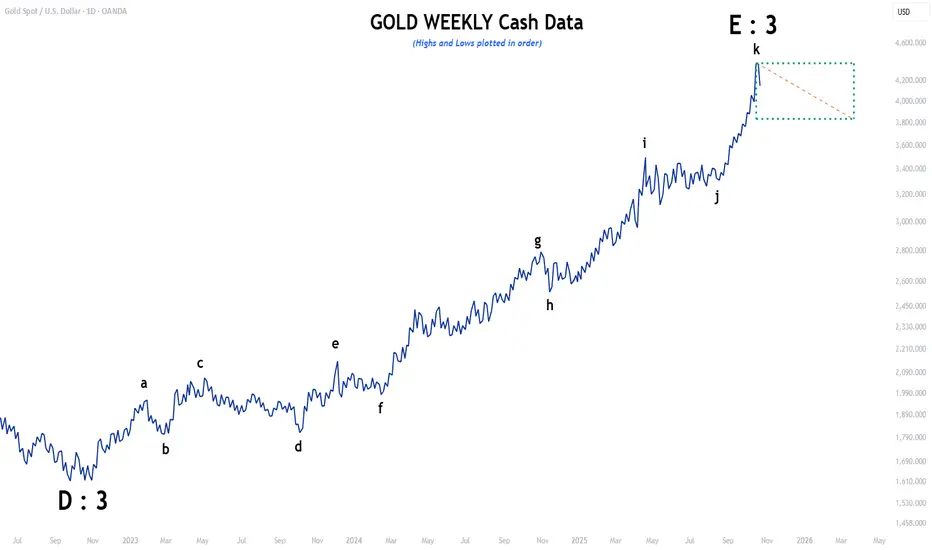
The top in Gold may be forming; however, confirmation requires a larger and faster decline than the strongest counter-trend wave observed within this entire structure. This phase represents one leg of a multi-decade diametric formation. The pattern itself is a newly identified structure within the realm of NeoWave theory, and much of this analysis is based on the Gold chart of Mr. Glenn Neely.
The price is should break below $3,850 before the end of March 2026, and this move could occur much sooner. However, this timeframe represents the maximum limit before the outlook becomes invalid.
I will post an update regarding the future of Gold , once we get a confirmation
The price is should break below $3,850 before the end of March 2026, and this move could occur much sooner. However, this timeframe represents the maximum limit before the outlook becomes invalid.
I will post an update regarding the future of Gold , once we get a confirmation

Disclaimer
The information and publications are not meant to be, and do not constitute, financial, investment, trading, or other types of advice or recommendations supplied or endorsed by TradingView. Read more in the Terms of Use.
Disclaimer
The information and publications are not meant to be, and do not constitute, financial, investment, trading, or other types of advice or recommendations supplied or endorsed by TradingView. Read more in the Terms of Use.