
Fundamental Analysis
Gold is attempting a modest recovery after last week’s sharp selloff. Softer oil prices on Monday have eased some immediate inflation pressure, while the U.S. 10-year Treasury yield has pulled back toward 4.97%. However, the macro environment remains fragile ahead of the October 27–28 FOMC meeting. Markets broadly expect the Fed to hold rates at 3.75%–4.00%, while pricing still implies a high probability of another hike in December. Thursday’s PCE inflation data will be another important catalyst.
This leaves Gold caught between short-term relief from lower oil/yields and the broader pressure from still-elevated rate expectations.
Technical Analysis
The H1 structure remains bearish.
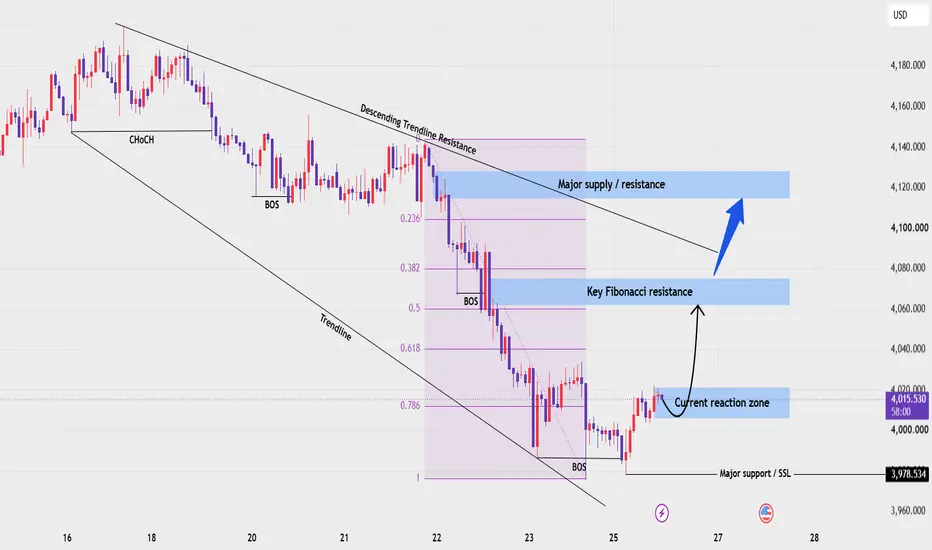
Gold has produced multiple BOS moves to the downside after failing to recover the previous bullish structure. Price is still trading beneath the descending trendline resistance, confirming that the broader correction remains intact.
However, price has now rebounded from the 3,975–3,990 Major Support / SSL area and returned toward the 4,000–4,020 Current Reaction Zone.
The important question is whether this rebound can develop into a larger corrective recovery or whether sellers will use the higher zones to re-enter the bearish structure.
The first major obstacle is the 4,060–4,075 Key Fibonacci Resistance. Above that sits the 4,115–4,130 Major Supply / Resistance Zone, which remains the strongest H1 barrier.
Important Key Levels
4,115–4,130: Major Supply / Resistance
4,060–4,075: Key Fibonacci Resistance
4,000–4,020: Current Reaction Zone
3,975–3,990: Major Support / SSL
Trading Scenario
The primary scenario is a corrective rebound inside the broader bearish structure.
If Gold continues holding 4,000–4,020, buyers could extend the recovery toward 4,060–4,075. This is the first major test because it aligns with the Fibonacci structure and previous downside pressure.
If price reaches that zone but fails to reclaim it, the broader bearish structure remains valid and Gold could rotate back toward 4,000–4,020, followed by a potential retest of 3,975–3,990.
A stronger recovery above 4,075 would shift attention toward the 4,115–4,130 Major Supply Zone, where the descending trendline becomes increasingly important.
Bullish Confirmation
The short-term recovery strengthens if Gold holds 4,000–4,020 and establishes higher H1 lows.
A sustained H1 reclaim above 4,060–4,075 would provide stronger evidence that the rebound is becoming more than a temporary correction.
However, failure around this Fibonacci resistance would keep the larger bearish structure intact.
Overall View
Gold is showing the first signs of stabilization after the sharp decline, but the H1 trend has not turned bullish yet.
For me, the structure is simple: 3,975–3,990 is the major floor, 4,000–4,020 is the current reaction zone, and 4,060–4,075 is the next real test.
As long as Gold remains below the descending trendline and the 4,115–4,130 supply zone, any recovery should be treated as a corrective phase rather than a confirmed trend reversal.
The upcoming Fed decision and PCE inflation data could provide the fundamental catalyst for whichever side ultimately takes control.
Gold is attempting a modest recovery after last week’s sharp selloff. Softer oil prices on Monday have eased some immediate inflation pressure, while the U.S. 10-year Treasury yield has pulled back toward 4.97%. However, the macro environment remains fragile ahead of the October 27–28 FOMC meeting. Markets broadly expect the Fed to hold rates at 3.75%–4.00%, while pricing still implies a high probability of another hike in December. Thursday’s PCE inflation data will be another important catalyst.
This leaves Gold caught between short-term relief from lower oil/yields and the broader pressure from still-elevated rate expectations.
Technical Analysis
The H1 structure remains bearish.
Gold has produced multiple BOS moves to the downside after failing to recover the previous bullish structure. Price is still trading beneath the descending trendline resistance, confirming that the broader correction remains intact.
However, price has now rebounded from the 3,975–3,990 Major Support / SSL area and returned toward the 4,000–4,020 Current Reaction Zone.
The important question is whether this rebound can develop into a larger corrective recovery or whether sellers will use the higher zones to re-enter the bearish structure.
The first major obstacle is the 4,060–4,075 Key Fibonacci Resistance. Above that sits the 4,115–4,130 Major Supply / Resistance Zone, which remains the strongest H1 barrier.
Important Key Levels
4,115–4,130: Major Supply / Resistance
4,060–4,075: Key Fibonacci Resistance
4,000–4,020: Current Reaction Zone
3,975–3,990: Major Support / SSL
Trading Scenario
The primary scenario is a corrective rebound inside the broader bearish structure.
If Gold continues holding 4,000–4,020, buyers could extend the recovery toward 4,060–4,075. This is the first major test because it aligns with the Fibonacci structure and previous downside pressure.
If price reaches that zone but fails to reclaim it, the broader bearish structure remains valid and Gold could rotate back toward 4,000–4,020, followed by a potential retest of 3,975–3,990.
A stronger recovery above 4,075 would shift attention toward the 4,115–4,130 Major Supply Zone, where the descending trendline becomes increasingly important.
Bullish Confirmation
The short-term recovery strengthens if Gold holds 4,000–4,020 and establishes higher H1 lows.
A sustained H1 reclaim above 4,060–4,075 would provide stronger evidence that the rebound is becoming more than a temporary correction.
However, failure around this Fibonacci resistance would keep the larger bearish structure intact.
Overall View
Gold is showing the first signs of stabilization after the sharp decline, but the H1 trend has not turned bullish yet.
For me, the structure is simple: 3,975–3,990 is the major floor, 4,000–4,020 is the current reaction zone, and 4,060–4,075 is the next real test.
As long as Gold remains below the descending trendline and the 4,115–4,130 supply zone, any recovery should be treated as a corrective phase rather than a confirmed trend reversal.
The upcoming Fed decision and PCE inflation data could provide the fundamental catalyst for whichever side ultimately takes control.
Trade active
Recovery Following the Plan
Gold is moving in line with the planned recovery. After defending the 3,975–3,990 Major Support / SSL, price has reclaimed the 4,000–4,020 Current Reaction Zone and is now attempting to build momentum toward the 4,060–4,075 Key Fibonacci Resistance.
The macro backdrop is also helping the rebound: softer oil prices have reduced immediate inflation pressure, while markets expect the Fed to hold rates this week. However, elevated expectations for a December hike could still limit Gold’s upside.
The next key test is 4,060–4,075. A sustained reclaim could open the path toward 4,115–4,130 Major Supply.

📊 XAU Macro Pulse · XAUUSD · GBPUSD · EURUSD
Every setup earns its place on the chart.
🔔 Follow the structure. The rest is noise.
Personal analysis only t.me/+ZahF8It14l40OWNl
Every setup earns its place on the chart.
🔔 Follow the structure. The rest is noise.
Personal analysis only t.me/+ZahF8It14l40OWNl
Related publications
Disclaimer
The information and publications are not meant to be, and do not constitute, financial, investment, trading, or other types of advice or recommendations supplied or endorsed by TradingView. Read more in the Terms of Use.
📊 XAU Macro Pulse · XAUUSD · GBPUSD · EURUSD
Every setup earns its place on the chart.
🔔 Follow the structure. The rest is noise.
Personal analysis only t.me/+ZahF8It14l40OWNl
Every setup earns its place on the chart.
🔔 Follow the structure. The rest is noise.
Personal analysis only t.me/+ZahF8It14l40OWNl
Related publications
Disclaimer
The information and publications are not meant to be, and do not constitute, financial, investment, trading, or other types of advice or recommendations supplied or endorsed by TradingView. Read more in the Terms of Use.