
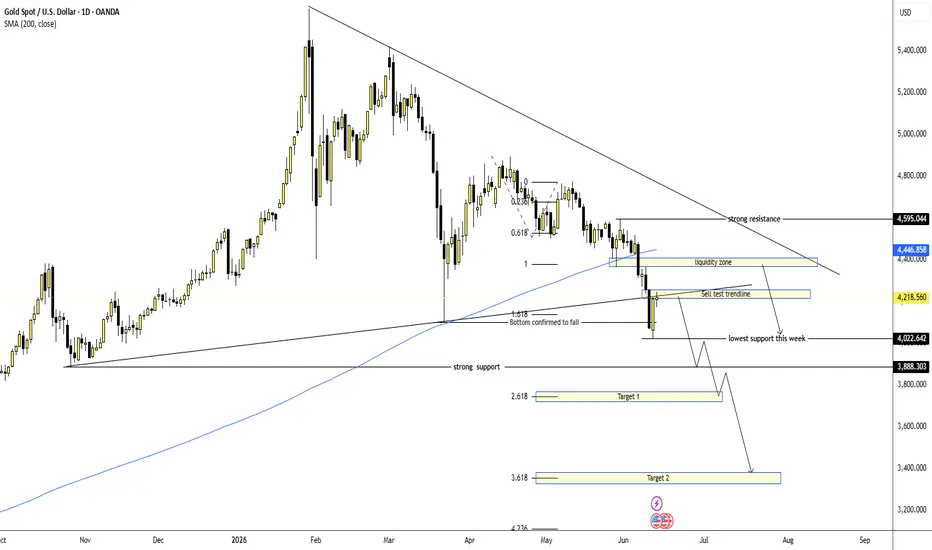
Gold Remains Bearish Below Major Trendline
Gold is still trading under clear weekly pressure after losing the rising support structure and failing to reclaim the higher liquidity area. The daily chart shows that sellers remain in control while price is moving below the SMA 200 and below the long-term descending trendline.
FUNDAMENTAL ANALYSIS
Gold remains sensitive to the U.S. dollar, Treasury yields and upcoming U.S. economic data. If the dollar stays firm and rate-cut expectations remain weak, gold may continue to face selling pressure next week.
For now, the technical structure is still more important. As long as gold cannot reclaim the broken support and liquidity zone above, bearish continuation remains the main view.
TECHNICAL ANALYSIS – SMC + FIBONACCI
From an SMC perspective, gold has broken below an important support structure and confirmed weakness after failing to hold the previous trendline base. The recent move shows bearish displacement, and price is now testing the broken trendline area from below.
The zone around 4,218 – 4,300 is important because it may act as a sell-test area. If price fails to reclaim this zone, sellers may continue to defend the structure.
Above price, the liquidity zone around 4,400 – 4,446 is a stronger resistance area, also close to the SMA 200. A deeper recovery into this zone would still be considered a bearish retest unless gold breaks and holds above it clearly.
The main downside focus is the weekly low near 4,022. If this level breaks, gold may continue toward the strong support around 3,888, followed by the Fibonacci extension targets near 3,730 and 3,380.
KEY PRICE ZONES TO WATCH
Current price area: 4,218
Sell test trendline area: 4,218 – 4,300
Liquidity zone / SMA 200 resistance: 4,400 – 4,446
Strong resistance: 4,595
Lowest support this week: 4,022
Strong support: 3,888
Fibonacci Target 1: 3,730 – 3,700
Fibonacci Target 2: 3,400 – 3,360
Invalidation area for sell view: Above 4,446 – 4,595
TRADING SCENARIOS
Sell Scenario – Priority Weekly View
If gold retests the 4,218 – 4,300 area and shows rejection, I will watch for a bearish continuation setup.
Sell Zone: 4,218 – 4,300
Entry Condition: Bearish rejection, failed retest, lower-timeframe CHoCH, or strong bearish displacement from the broken trendline area.
Stop Loss: Above 4,300 or above the nearest swing high.
Take Profit:
TP1: 4,022
TP2: 3,888
TP3: 3,730 – 3,700
Alternative Sell Scenario
If gold recovers deeper into the 4,400 – 4,446 liquidity zone, I will still watch for sell reaction if price fails to reclaim the SMA 200 and descending trendline.
Sell Condition: Wait for rejection from 4,400 – 4,446 with bearish confirmation on the smaller timeframe.
Target: 4,022 – 3,888
Buy Scenario – Only Corrective Recovery
A buy setup is not the main view for next week. However, if gold holds above 4,022 and creates a bullish reaction, a short-term corrective bounce may appear.
Buy Zone: 4,022 – 4,000
Entry Condition: Liquidity sweep, bullish rejection, or lower-timeframe bullish CHoCH.
Take Profit:
TP1: 4,218
TP2: 4,300
Invalidation: If price breaks and holds below 4,022, the buy idea is invalid.
MY VIEW ON GOLD
My weekly view for gold remains bearish. The chart shows that price has lost an important support structure and is now trading below the SMA 200, while the descending trendline continues to pressure the market from above.
The cleaner plan is to wait for gold to retest resistance, then observe seller reaction on the smaller timeframe. The 4,218 – 4,300 area is the first sell-test zone, while 4,400 – 4,446 is the stronger liquidity resistance if price recovers deeper.
Overall, gold remains weak unless buyers can reclaim the liquidity zone and hold above the SMA 200. If 4,022 breaks, the next weekly downside path may open toward 3,888 and the Fibonacci extension targets below.
Do you think gold will reject from the trendline retest next week, or will price recover deeper into the 4,400 liquidity zone first?

Trading is a journey. The destination is mastering yourself
Structure • Liquidity • Confirmation • Risk
t.me/+8W6dCJj-UpU4YmFl
Structure • Liquidity • Confirmation • Risk
t.me/+8W6dCJj-UpU4YmFl
Related publications
Disclaimer
The information and publications are not meant to be, and do not constitute, financial, investment, trading, or other types of advice or recommendations supplied or endorsed by TradingView. Read more in the Terms of Use.