
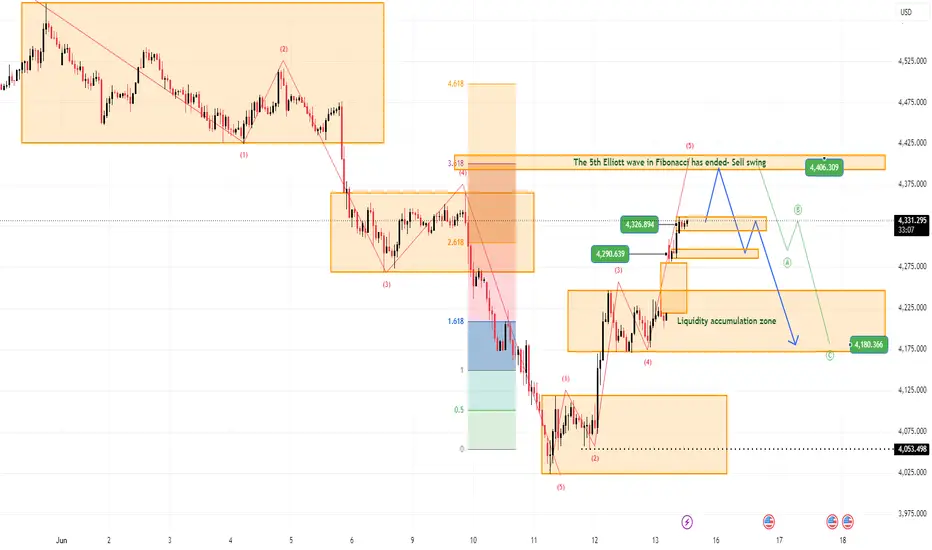
Gold is pushing into an important resistance area after a strong recovery from the lower liquidity base around 4,053. From Kelly’s view, the current advance is now approaching the final part of a short-term Elliott Wave structure, where wave 5 may be close to completion.
The key idea is simple: gold is still rising, but price is now entering a Fibonacci resistance zone where the next reaction becomes very important.
⟡ Market structure
The chart shows a strong recovery from the 4,053 support area, followed by a clean bullish wave sequence through 4,180 and 4,290. Buyers have managed to push price back above the liquidity accumulation zone, which confirms that short-term momentum has improved.
However, gold is now trading near 4,326 and approaching the 4,406 resistance area, where the chart marks the possible end of wave 5. This zone also aligns with the Fibonacci extension area, making it an important reaction point for the next swing.
If price continues higher into 4,360–4,406 but begins to slow down, the market may start forming a sell swing from resistance.
➤ Key levels
◌ 4,290–4,326: current reaction and short-term support
◌ 4,360–4,406: Fibonacci resistance and wave 5 completion zone
◌ 4,180–4,240: liquidity accumulation zone
◌ 4,053: major support and invalidation area
◌ Below 4,180: area where the bullish recovery starts to weaken
⌁ Elliott Wave view
From an Elliott Wave perspective, gold appears to be developing a 5-wave bullish recovery after the previous ABC structure completed near the lower zone.
Wave 1 started from the 4,053 area.
Wave 2 corrected back into the base.
Wave 3 expanded strongly towards 4,290.
Wave 4 held above the accumulation zone.
Wave 5 is now developing towards the Fibonacci resistance zone around 4,360–4,406.
If wave 5 completes near this area and price prints rejection, gold may begin an A-B-C corrective pullback towards 4,240 or even 4,180.
▸ Trading scenario
Preferred scenario: wait for wave 5 to complete near the Fibonacci resistance area before looking for a reaction.
Sell reaction zone: 4,360–4,406 if bearish confirmation appears
Stop loss: above the confirmed wave 5 high
Take profit 1: 4,290
Take profit 2: 4,240
Take profit 3: 4,180
Alternative scenario: if gold breaks above 4,406 and holds with strong acceptance, the wave 5 sell swing idea weakens, and the market may continue extending higher before forming a new structure.
⌁ Kelly’s view
For Kelly, this is not a place to chase the upside aggressively. The recovery has been strong, but price is now moving into the zone where wave 5 may finish.
The cleaner approach is to watch how gold reacts around 4,360–4,406. If rejection appears, the market may shift from bullish continuation into a corrective sell swing.
Gold is still rising.
But structurally, wave 5 may be approaching its final resistance zone.
Share your view below.
The key idea is simple: gold is still rising, but price is now entering a Fibonacci resistance zone where the next reaction becomes very important.
⟡ Market structure
The chart shows a strong recovery from the 4,053 support area, followed by a clean bullish wave sequence through 4,180 and 4,290. Buyers have managed to push price back above the liquidity accumulation zone, which confirms that short-term momentum has improved.
However, gold is now trading near 4,326 and approaching the 4,406 resistance area, where the chart marks the possible end of wave 5. This zone also aligns with the Fibonacci extension area, making it an important reaction point for the next swing.
If price continues higher into 4,360–4,406 but begins to slow down, the market may start forming a sell swing from resistance.
➤ Key levels
◌ 4,290–4,326: current reaction and short-term support
◌ 4,360–4,406: Fibonacci resistance and wave 5 completion zone
◌ 4,180–4,240: liquidity accumulation zone
◌ 4,053: major support and invalidation area
◌ Below 4,180: area where the bullish recovery starts to weaken
⌁ Elliott Wave view
From an Elliott Wave perspective, gold appears to be developing a 5-wave bullish recovery after the previous ABC structure completed near the lower zone.
Wave 1 started from the 4,053 area.
Wave 2 corrected back into the base.
Wave 3 expanded strongly towards 4,290.
Wave 4 held above the accumulation zone.
Wave 5 is now developing towards the Fibonacci resistance zone around 4,360–4,406.
If wave 5 completes near this area and price prints rejection, gold may begin an A-B-C corrective pullback towards 4,240 or even 4,180.
▸ Trading scenario
Preferred scenario: wait for wave 5 to complete near the Fibonacci resistance area before looking for a reaction.
Sell reaction zone: 4,360–4,406 if bearish confirmation appears
Stop loss: above the confirmed wave 5 high
Take profit 1: 4,290
Take profit 2: 4,240
Take profit 3: 4,180
Alternative scenario: if gold breaks above 4,406 and holds with strong acceptance, the wave 5 sell swing idea weakens, and the market may continue extending higher before forming a new structure.
⌁ Kelly’s view
For Kelly, this is not a place to chase the upside aggressively. The recovery has been strong, but price is now moving into the zone where wave 5 may finish.
The cleaner approach is to watch how gold reacts around 4,360–4,406. If rejection appears, the market may shift from bullish continuation into a corrective sell swing.
Gold is still rising.
But structurally, wave 5 may be approaching its final resistance zone.
Share your view below.
Trade active
Note that at the end of wave 5, the price will react in an ABC pattern.

📌 New analysis published daily
🔔 Follow this profile for real-time updates
⚠️ This is personal analysis, not financial advice
Daily GOLD and Forex updates: t.me/+SOSI26CZOJ1mZDhl
🔔 Follow this profile for real-time updates
⚠️ This is personal analysis, not financial advice
Daily GOLD and Forex updates: t.me/+SOSI26CZOJ1mZDhl
Disclaimer
The information and publications are not meant to be, and do not constitute, financial, investment, trading, or other types of advice or recommendations supplied or endorsed by TradingView. Read more in the Terms of Use.
📌 New analysis published daily
🔔 Follow this profile for real-time updates
⚠️ This is personal analysis, not financial advice
Daily GOLD and Forex updates: t.me/+SOSI26CZOJ1mZDhl
🔔 Follow this profile for real-time updates
⚠️ This is personal analysis, not financial advice
Daily GOLD and Forex updates: t.me/+SOSI26CZOJ1mZDhl
Disclaimer
The information and publications are not meant to be, and do not constitute, financial, investment, trading, or other types of advice or recommendations supplied or endorsed by TradingView. Read more in the Terms of Use.