
Gold Is Still Trading Heavy — $4,200 Remains the Downside Magnet
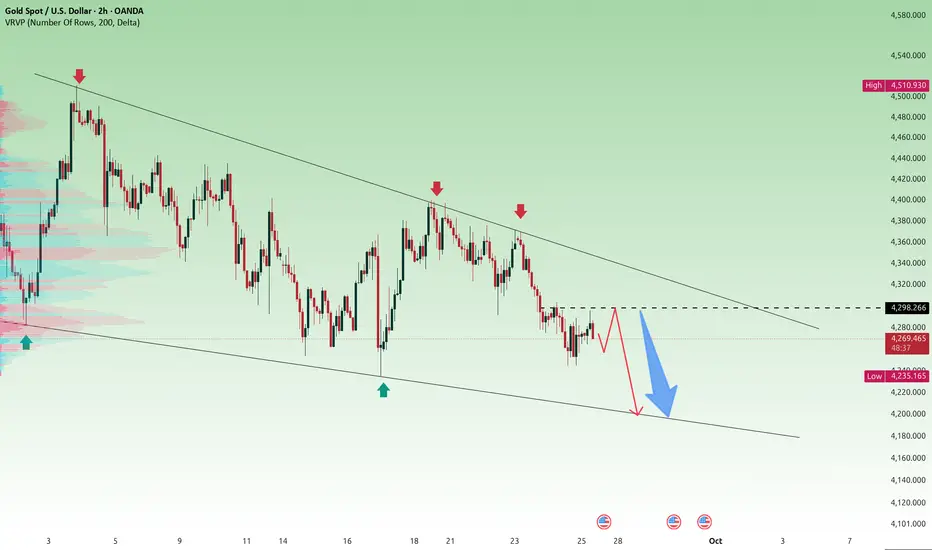
Gold is beginning Friday’s session without any convincing sign that buyers have regained control. On the 2H OANDA chart, XAU/USD is trading around 4,270.085, and the more important message is not the size of the latest move — it is the way price continues to respect the broader bearish structure.
The macro backdrop is still working against gold. Reuters reported spot gold at $4,288.36 earlier today, with the metal down roughly 2% for the week. The U.S. dollar is heading for a weekly gain, Treasury yields have extended higher, and Fed officials have indicated that additional tightening may still be needed to contain inflation. That combination continues to raise the opportunity cost of holding non-yielding gold.
Technically, the chart remains well organized inside a descending channel. The repeated failures along the upper boundary have created a clear sequence of lower highs, while the latest recovery has struggled to develop any meaningful momentum. For me, that is the key point: gold is not simply falling — every rebound is being absorbed before the structure can turn bullish.
The first level that matters is 4,298.266. As long as price remains below this zone, the current recovery should still be treated as corrective. A push into 4,298 followed by rejection would keep sellers firmly in control and preserve the bearish continuation setup.
On the downside, 4,235.165 is the level that can unlock the next leg. A decisive break below that low would confirm renewed weakness and expose the lower boundary of the channel.
That brings 4,200.000 into focus as the primary objective.
The level is technically meaningful because it sits close to the projected lower channel boundary while also acting as a major psychological price zone. If 4,235.165 gives way, a move toward 4,200 would fit naturally with the existing market structure rather than represent an unusually aggressive bearish extension.
For now, the framework is straightforward: below 4,298.266, the bearish structure remains intact; below 4,235.165, 4,200.000 becomes the main downside target. A sustained reclaim above 4,298 and the descending trendline would be the first sign that this view needs to be reassessed.
Technical analysis only, not financial advice.
The macro backdrop is still working against gold. Reuters reported spot gold at $4,288.36 earlier today, with the metal down roughly 2% for the week. The U.S. dollar is heading for a weekly gain, Treasury yields have extended higher, and Fed officials have indicated that additional tightening may still be needed to contain inflation. That combination continues to raise the opportunity cost of holding non-yielding gold.
Technically, the chart remains well organized inside a descending channel. The repeated failures along the upper boundary have created a clear sequence of lower highs, while the latest recovery has struggled to develop any meaningful momentum. For me, that is the key point: gold is not simply falling — every rebound is being absorbed before the structure can turn bullish.
The first level that matters is 4,298.266. As long as price remains below this zone, the current recovery should still be treated as corrective. A push into 4,298 followed by rejection would keep sellers firmly in control and preserve the bearish continuation setup.
On the downside, 4,235.165 is the level that can unlock the next leg. A decisive break below that low would confirm renewed weakness and expose the lower boundary of the channel.
That brings 4,200.000 into focus as the primary objective.
The level is technically meaningful because it sits close to the projected lower channel boundary while also acting as a major psychological price zone. If 4,235.165 gives way, a move toward 4,200 would fit naturally with the existing market structure rather than represent an unusually aggressive bearish extension.
For now, the framework is straightforward: below 4,298.266, the bearish structure remains intact; below 4,235.165, 4,200.000 becomes the main downside target. A sustained reclaim above 4,298 and the descending trendline would be the first sign that this view needs to be reassessed.
Technical analysis only, not financial advice.
Trade active
Trade closed: target reached

🚀 SMART CRYPTO TRADING STARTS HERE!
BTC • ETH • ALTCOINS
🎯 Daily Signals | Entry • TP • SL
⚡ Real-Time Alerts & Market Insights
💎 VIP Signals & Private Support
🔥 TRADE SMARTER. STAY AHEAD.
👇 JOIN OUR COMMUNITY
t.me/+22Cs-Z14bJg3NDJl
BTC • ETH • ALTCOINS
🎯 Daily Signals | Entry • TP • SL
⚡ Real-Time Alerts & Market Insights
💎 VIP Signals & Private Support
🔥 TRADE SMARTER. STAY AHEAD.
👇 JOIN OUR COMMUNITY
t.me/+22Cs-Z14bJg3NDJl
Related publications
Disclaimer
The information and publications are not meant to be, and do not constitute, financial, investment, trading, or other types of advice or recommendations supplied or endorsed by TradingView. Read more in the Terms of Use.
🚀 SMART CRYPTO TRADING STARTS HERE!
BTC • ETH • ALTCOINS
🎯 Daily Signals | Entry • TP • SL
⚡ Real-Time Alerts & Market Insights
💎 VIP Signals & Private Support
🔥 TRADE SMARTER. STAY AHEAD.
👇 JOIN OUR COMMUNITY
t.me/+22Cs-Z14bJg3NDJl
BTC • ETH • ALTCOINS
🎯 Daily Signals | Entry • TP • SL
⚡ Real-Time Alerts & Market Insights
💎 VIP Signals & Private Support
🔥 TRADE SMARTER. STAY AHEAD.
👇 JOIN OUR COMMUNITY
t.me/+22Cs-Z14bJg3NDJl
Related publications
Disclaimer
The information and publications are not meant to be, and do not constitute, financial, investment, trading, or other types of advice or recommendations supplied or endorsed by TradingView. Read more in the Terms of Use.