
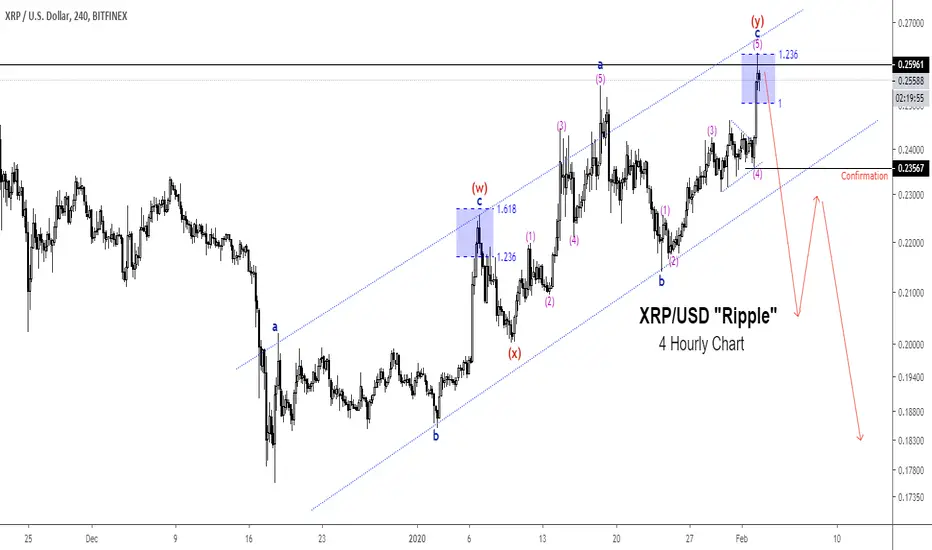
Ripple "XRPUSD" has gained almost 49% gain from its December 2019 low. However, the structure of the advance is more corrective than impulsive.
The current pattern on the chart is called a double zigzag according to the Elliot Wave principle. Wave (y) of the zigzag also equals 1.236 of wave (a) at a critical weekly resistance level that lined up with 200 Daily Moving Average.

What this means is that we would likely see a new low or at least Ripple will lose 50% of 2020 gain from or near the current market price.
The break of wave (4) of c of (y) or the flag channel will confirm the bearish bias.
Do you think Ripple will continue the rally?
The current pattern on the chart is called a double zigzag according to the Elliot Wave principle. Wave (y) of the zigzag also equals 1.236 of wave (a) at a critical weekly resistance level that lined up with 200 Daily Moving Average.
What this means is that we would likely see a new low or at least Ripple will lose 50% of 2020 gain from or near the current market price.
The break of wave (4) of c of (y) or the flag channel will confirm the bearish bias.
Do you think Ripple will continue the rally?

Disclaimer
The information and publications are not meant to be, and do not constitute, financial, investment, trading, or other types of advice or recommendations supplied or endorsed by TradingView. Read more in the Terms of Use.
Disclaimer
The information and publications are not meant to be, and do not constitute, financial, investment, trading, or other types of advice or recommendations supplied or endorsed by TradingView. Read more in the Terms of Use.