WTI Crude Oil ( XTIUSD) Daily: Momentum Accelerates Above Reclaimed 200-EMA Toward Key Wedge Resistance
### 🛢️ WTI Light Crude Oil (XTIUSD / USOIL) Daily Technical Matrix (Ref: XTIUSD_2026-08-12_08-41-35.png)
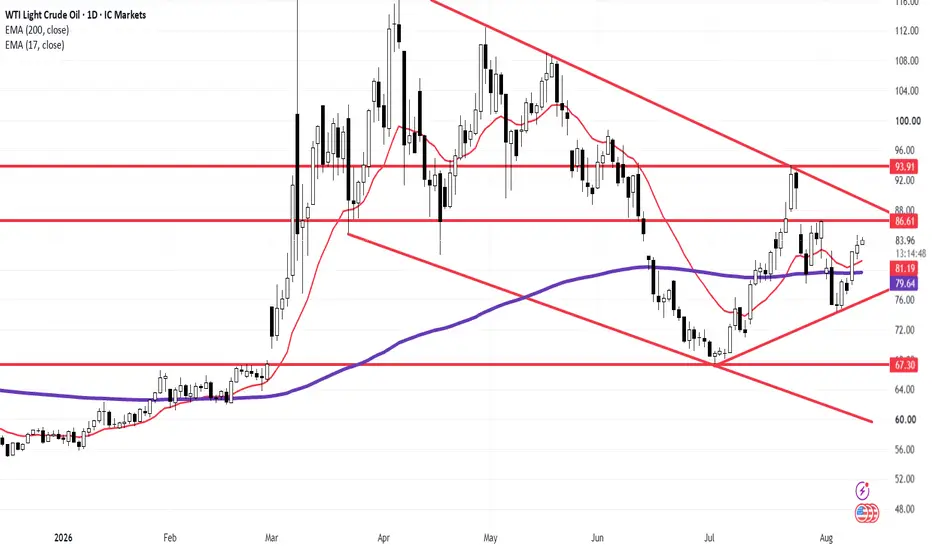
We are releasing an updated Daily (1D) structural framework on WTI Light Crude Oil (XTIUSD / USOIL). Following a successful defense of the lower trendline support and the reclamation of its key moving average cluster, price action is expanding higher inside the macro multi-month consolidation wedge.
Crude Oil is currently trading with active buy-side control at **83.94 (+0.73%)**, positioning for a retest of overhead static resistance.
---
### 🔍 Technical Architecture & Structural Dynamics:
Our quantitative setup isolates key dynamic support levels and primary resistance targets:
1. **Dual EMA Reclaim & Dynamic Support:** Price action has established a firm base above both the **200-period EMA (purple line at 79.64)** and the **17-period EMA (red line at 81.18)**, confirming a shift back toward short-term bullish momentum.
2. **Macro Wedge Squeeze Structure (Diagonal Red Lines):** Crude Oil remains contained within a broad multi-month wedge, bounded by the ascending support line originating from the **67.30** macro floor and the primary descending resistance line originating from multi-month highs.
3. **Key Horizontal Resistance Barriers:**
* **Immediate Overhead Ceiling:** **86.61** — Primary dynamic test point aligned with upper wedge supply.
* **Secondary Structural Target:** **93.91** — Major horizontal liquidity pocket.
---
### 🛡️ Strategic Operational Scenarios:
* **Scenario A — Bullish Wedge Retest & Breakout Extension:** Sustained buy-side momentum above the **81.18** EMA floor targets an immediate retest of **86.61**. A decisive daily break above **86.61** and the upper descending trendline will trigger a volatility expansion toward **93.91**.
* **Scenario B — Pullback Rejection to Dynamic EMA Support:** Any temporary profit-taking off overhead supply will find immediate absorption at the **17-EMA (81.18)** and the **200-EMA (79.64)** floor, preserving the active higher-low structure.
### 📊 Tactical Parameters Summary:
* **Current Bias:** Neutral-Bullish / Rebound Expansion Above 200-EMA
* **Immediate Static Resistance:** 86.61
* **Secondary Upside Ceiling:** 93.91
* **Immediate Dynamic Support (17-EMA):** 81.18
* **Institutional Base Support (200-EMA):** 79.64
* **Macro Structural Floor:** 67.30
---
📊 **ChartPro Data**
*Energy Market Architecture, Dynamic EMA Confluences & Systematic Risk Management.*
⚠️ **Disclaimer:** For educational and informational purposes only. This active market study represents a personal trading framework and does not constitute financial or investment advice.
XTIUSD) Daily: Momentum Accelerates Above Reclaimed 200-EMA Toward Key Wedge Resistance### 🛢️ WTI Light Crude Oil (
XTIUSD / USOIL) Daily Technical Matrix (Ref: XTIUSD_2026-08-12_08-41-35.png)We are releasing an updated Daily (1D) structural framework on WTI Light Crude Oil (
XTIUSD / USOIL). Following a successful defense of the lower trendline support and the reclamation of its key moving average cluster, price action is expanding higher inside the macro multi-month consolidation wedge.Crude Oil is currently trading with active buy-side control at **83.94 (+0.73%)**, positioning for a retest of overhead static resistance.
---
### 🔍 Technical Architecture & Structural Dynamics:
Our quantitative setup isolates key dynamic support levels and primary resistance targets:
1. **Dual EMA Reclaim & Dynamic Support:** Price action has established a firm base above both the **200-period EMA (purple line at 79.64)** and the **17-period EMA (red line at 81.18)**, confirming a shift back toward short-term bullish momentum.
2. **Macro Wedge Squeeze Structure (Diagonal Red Lines):** Crude Oil remains contained within a broad multi-month wedge, bounded by the ascending support line originating from the **67.30** macro floor and the primary descending resistance line originating from multi-month highs.
3. **Key Horizontal Resistance Barriers:**
* **Immediate Overhead Ceiling:** **86.61** — Primary dynamic test point aligned with upper wedge supply.
* **Secondary Structural Target:** **93.91** — Major horizontal liquidity pocket.
---
### 🛡️ Strategic Operational Scenarios:
* **Scenario A — Bullish Wedge Retest & Breakout Extension:** Sustained buy-side momentum above the **81.18** EMA floor targets an immediate retest of **86.61**. A decisive daily break above **86.61** and the upper descending trendline will trigger a volatility expansion toward **93.91**.
* **Scenario B — Pullback Rejection to Dynamic EMA Support:** Any temporary profit-taking off overhead supply will find immediate absorption at the **17-EMA (81.18)** and the **200-EMA (79.64)** floor, preserving the active higher-low structure.
### 📊 Tactical Parameters Summary:
* **Current Bias:** Neutral-Bullish / Rebound Expansion Above 200-EMA
* **Immediate Static Resistance:** 86.61
* **Secondary Upside Ceiling:** 93.91
* **Immediate Dynamic Support (17-EMA):** 81.18
* **Institutional Base Support (200-EMA):** 79.64
* **Macro Structural Floor:** 67.30
---
📊 **ChartPro Data**
*Energy Market Architecture, Dynamic EMA Confluences & Systematic Risk Management.*
⚠️ **Disclaimer:** For educational and informational purposes only. This active market study represents a personal trading framework and does not constitute financial or investment advice.

Disclaimer
The information and publications are not meant to be, and do not constitute, financial, investment, trading, or other types of advice or recommendations supplied or endorsed by TradingView. Read more in the Terms of Use.
Disclaimer
The information and publications are not meant to be, and do not constitute, financial, investment, trading, or other types of advice or recommendations supplied or endorsed by TradingView. Read more in the Terms of Use.