
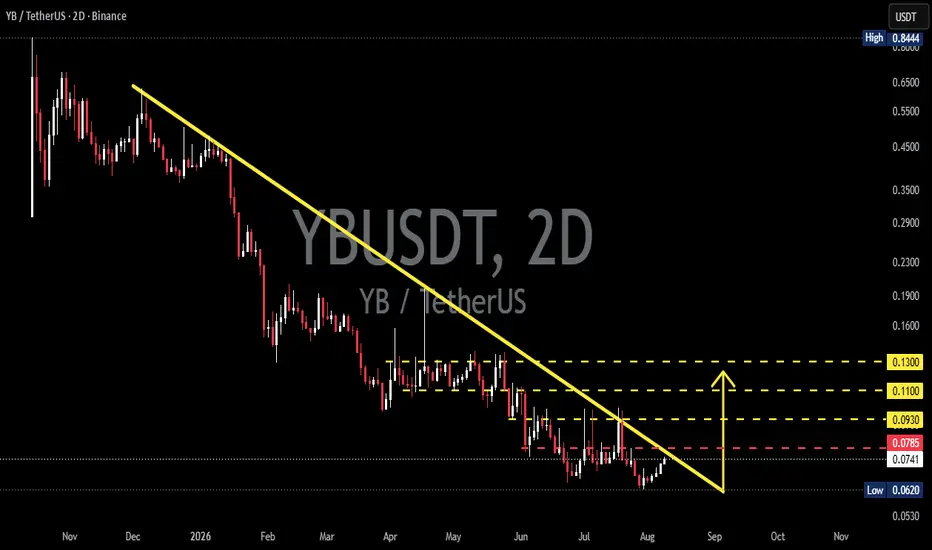
🔎📊 CHART ANALYSIS
🟡 YB/USDT is still under bearish pressure, and the price action since late 2025 appears to be forming a structure of Lower Highs (LH) 📉 and Lower Lows (LL) 📉.
📉 The Descending TrendLine is acting as the main dynamic resistance 🔴, continuously putting pressure on price. Several attempts to move higher 📈 have resulted in rejections ⛔ near this trendline.
🟢 The current price is around $0.0739, relatively close to the $0.0785 resistance 🔴 and the Descending TrendLine 📐.
⚠️ $0.0785 is an important level because a breakout 🚀 above it could be an early indication that bearish pressure is starting to weaken 📉➡️📈.
---
📐🔻 PATTERN: DESCENDING TRENDLINE
🔻 The Descending TrendLine is formed by a series of Lower Highs 📉, connected through a downward-sloping resistance line.
📌 As long as price remains below the trendline ⬇️, the overall structure remains bearish 🔴.
🔥 However, if a 2D candle successfully breaks out 🚀 and closes strongly above the Descending TrendLine, the market structure could potentially shift from bearish 🔴 to bullish 🟢.
🔄 After the breakout, a retest 🔁 of the trendline could provide additional confirmation that the previous resistance has turned into support 🟢.
---
🟢🚀 BULLISH SCENARIO
🚀 The bullish scenario becomes increasingly valid if YB breaks above the Descending TrendLine 📐 and clears $0.0785 🔓.
✅ Stronger confirmation:
🟢 Breakout above the Descending TrendLine 🚀
🟢 2D candle close 📊 above resistance
🟢 Price holds above $0.0785 💪
🔄 Successful retest with the former resistance becoming support 🛡️
🎯🚀 BULLISH TARGETS
🥇 $0.0930 → 🎯 First target / next resistance
🥈 $0.1100 → 🎯 Second target
🥉 $0.1300 → 🎯 Major target shown on the chart
📈 If $0.1300 💥 is successfully broken with strong momentum, the bullish structure could become significantly stronger 🔥, potentially opening the way toward higher resistance levels 🚀.
---
🔴⚠️ BEARISH SCENARIO
⚠️ If YB fails to break the Descending TrendLine 📐 and receives another rejection ⛔, bearish pressure is likely to remain dominant 🔴.
🔻 $0.0785 is a key resistance 🚧. A strong rejection from this area could send price lower again 📉.
📉 If the support around $0.0739 fails ❌, price could potentially revisit the previous low area 🔻.
🎯🔻 BEARISH LEVELS
🔻 $0.0739 → 🛡️ Current/support area
🔻 $0.0620 → 🛡️ Major support / recent low
🔻 $0.0530 → ⚠️ Lower support if $0.0620 breaks
🚨 A break below $0.0620 would be a stronger bearish signal 🔴📉 and could potentially extend the current downtrend ⬇️.
---
🎯👀 KEY LEVELS TO WATCH
🟢 $0.0785 → 🚀 Breakout confirmation area
🟡 $0.0930 → 🎯 First bullish target
🟡 $0.1100 → 🎯 Second bullish target
🟡 $0.1300 → 🚀 Major bullish target
🔴 $0.0739 → 🛡️ Current/support area
🔴 $0.0620 → 🧱 Major support
🔴 $0.0530 → ⚠️ Bearish continuation level
---
🧠📊 MARKET OUTLOOK
📊 Overall Trend: 🔴 Bearish
📐 Pattern: 🔻 Descending TrendLine
⚔️ Key Battle: $0.0785 🆚 Descending TrendLine
🚀 Bullish Trigger: Breakout + 2D close 🕯️ above the trendline
🎯 Bullish Targets: $0.093 → $0.110 → $0.130 🚀
🔻 Bearish Trigger: Rejection + loss of $0.0739 / $0.0620 📉
---
💡🔥 CONCLUSION
📊 YB is currently in a very interesting area to watch 👀, as price is approaching the major resistance 🔴 that has been suppressing price for several months.
⚠️ Do not consider a breakout based only on a wick 🕯️❌ — a confirmed 2D candle close ✅ above the Descending TrendLine would provide a stronger signal 💪📈.
🚀 VALID BREAKOUT = POTENTIAL STRUCTURE SHIFT 📈🔥
⚠️ REJECTION = BEARISH TREND CONTINUES 📉🔻
🎯 Patience + Confirmation = Better Setup 🧠📊
🟡 YB/USDT is still under bearish pressure, and the price action since late 2025 appears to be forming a structure of Lower Highs (LH) 📉 and Lower Lows (LL) 📉.
📉 The Descending TrendLine is acting as the main dynamic resistance 🔴, continuously putting pressure on price. Several attempts to move higher 📈 have resulted in rejections ⛔ near this trendline.
🟢 The current price is around $0.0739, relatively close to the $0.0785 resistance 🔴 and the Descending TrendLine 📐.
⚠️ $0.0785 is an important level because a breakout 🚀 above it could be an early indication that bearish pressure is starting to weaken 📉➡️📈.
---
📐🔻 PATTERN: DESCENDING TRENDLINE
🔻 The Descending TrendLine is formed by a series of Lower Highs 📉, connected through a downward-sloping resistance line.
📌 As long as price remains below the trendline ⬇️, the overall structure remains bearish 🔴.
🔥 However, if a 2D candle successfully breaks out 🚀 and closes strongly above the Descending TrendLine, the market structure could potentially shift from bearish 🔴 to bullish 🟢.
🔄 After the breakout, a retest 🔁 of the trendline could provide additional confirmation that the previous resistance has turned into support 🟢.
---
🟢🚀 BULLISH SCENARIO
🚀 The bullish scenario becomes increasingly valid if YB breaks above the Descending TrendLine 📐 and clears $0.0785 🔓.
✅ Stronger confirmation:
🟢 Breakout above the Descending TrendLine 🚀
🟢 2D candle close 📊 above resistance
🟢 Price holds above $0.0785 💪
🔄 Successful retest with the former resistance becoming support 🛡️
🎯🚀 BULLISH TARGETS
🥇 $0.0930 → 🎯 First target / next resistance
🥈 $0.1100 → 🎯 Second target
🥉 $0.1300 → 🎯 Major target shown on the chart
📈 If $0.1300 💥 is successfully broken with strong momentum, the bullish structure could become significantly stronger 🔥, potentially opening the way toward higher resistance levels 🚀.
---
🔴⚠️ BEARISH SCENARIO
⚠️ If YB fails to break the Descending TrendLine 📐 and receives another rejection ⛔, bearish pressure is likely to remain dominant 🔴.
🔻 $0.0785 is a key resistance 🚧. A strong rejection from this area could send price lower again 📉.
📉 If the support around $0.0739 fails ❌, price could potentially revisit the previous low area 🔻.
🎯🔻 BEARISH LEVELS
🔻 $0.0739 → 🛡️ Current/support area
🔻 $0.0620 → 🛡️ Major support / recent low
🔻 $0.0530 → ⚠️ Lower support if $0.0620 breaks
🚨 A break below $0.0620 would be a stronger bearish signal 🔴📉 and could potentially extend the current downtrend ⬇️.
---
🎯👀 KEY LEVELS TO WATCH
🟢 $0.0785 → 🚀 Breakout confirmation area
🟡 $0.0930 → 🎯 First bullish target
🟡 $0.1100 → 🎯 Second bullish target
🟡 $0.1300 → 🚀 Major bullish target
🔴 $0.0739 → 🛡️ Current/support area
🔴 $0.0620 → 🧱 Major support
🔴 $0.0530 → ⚠️ Bearish continuation level
---
🧠📊 MARKET OUTLOOK
📊 Overall Trend: 🔴 Bearish
📐 Pattern: 🔻 Descending TrendLine
⚔️ Key Battle: $0.0785 🆚 Descending TrendLine
🚀 Bullish Trigger: Breakout + 2D close 🕯️ above the trendline
🎯 Bullish Targets: $0.093 → $0.110 → $0.130 🚀
🔻 Bearish Trigger: Rejection + loss of $0.0739 / $0.0620 📉
---
💡🔥 CONCLUSION
📊 YB is currently in a very interesting area to watch 👀, as price is approaching the major resistance 🔴 that has been suppressing price for several months.
⚠️ Do not consider a breakout based only on a wick 🕯️❌ — a confirmed 2D candle close ✅ above the Descending TrendLine would provide a stronger signal 💪📈.
🚀 VALID BREAKOUT = POTENTIAL STRUCTURE SHIFT 📈🔥
⚠️ REJECTION = BEARISH TREND CONTINUES 📉🔻
🎯 Patience + Confirmation = Better Setup 🧠📊

✅ Get Free Signals! Join Our Telegram Channel Here: t.me/TheCryptoNuclear
✅ Twitter: twitter.com/crypto_nuclear
✅ Join Bybit : partner.bybit.com/b/nuclearvip
✅ Benefits : Lifetime Trading Fee Discount -50%
✅ Twitter: twitter.com/crypto_nuclear
✅ Join Bybit : partner.bybit.com/b/nuclearvip
✅ Benefits : Lifetime Trading Fee Discount -50%
Disclaimer
The information and publications are not meant to be, and do not constitute, financial, investment, trading, or other types of advice or recommendations supplied or endorsed by TradingView. Read more in the Terms of Use.
✅ Get Free Signals! Join Our Telegram Channel Here: t.me/TheCryptoNuclear
✅ Twitter: twitter.com/crypto_nuclear
✅ Join Bybit : partner.bybit.com/b/nuclearvip
✅ Benefits : Lifetime Trading Fee Discount -50%
✅ Twitter: twitter.com/crypto_nuclear
✅ Join Bybit : partner.bybit.com/b/nuclearvip
✅ Benefits : Lifetime Trading Fee Discount -50%
Disclaimer
The information and publications are not meant to be, and do not constitute, financial, investment, trading, or other types of advice or recommendations supplied or endorsed by TradingView. Read more in the Terms of Use.