 E-mini Dow Jones ($5) Futures
Education
Options Blueprint [Int]: Call Spreads Around Relative Weakness
More exclusive indicators from traddictiv
Subscribe to UFO Trading Suite — AutoClimate™ + AutoUFOs® (patented) for $55.00/month to get exclusive indicators by this author. You pay right on TradingView and can use them on your charts straight away.
Explore UFO Trading Suite — AutoClimate™ + AutoUFOs® (patented)Market Context: Understanding Relative Weakness
Markets rarely move in isolation. One of the most informative signals available to traders is not just price direction, but how one market behaves relative to another. This concept, known as relative weakness, becomes especially relevant when one index pushes into new highs while another fails to confirm.
In the current environment, we observe a divergence: while one major equity benchmark continues to explore higher ground, another is struggling to reclaim prior highs. This lack of confirmation is not just noise—it reflects underlying differences in participation, sector rotation, and institutional positioning.
From a behavioral standpoint, when a market fails to print new highs while its peers do, it often implies:
This creates a subtle but important shift: instead of chasing upside continuation, the focus transitions toward areas where price may encounter resistance.
Technical Framework: Resistance and Double Top Dynamics
The chart structure reveals a potential double top formation, a pattern that signals repeated rejection at similar price levels. However, it is critical to move beyond textbook definitions and focus on why this matters.
A double top is not simply two peaks—it represents:
In this case, resistance should not be treated as a single price, but rather as a zone. This zone sits above the recent high and extends into the area approaching the all-time high. Within this region, prior activity suggests the presence of UnFilled Orders (UFOs)—areas where selling pressure previously exceeded buying interest.
This is where many participants make a critical mistake: assuming that once price revisits resistance, it will break. In reality, markets often require multiple attempts to absorb supply, and until that happens, resistance remains structurally relevant.
The key takeaway here is simple:
Strategy Selection: Why a Bear Call Spread?
Given this backdrop, directional trading becomes less attractive than structured positioning. Instead of relying on a strong downward move, the objective shifts toward capturing value from price not exceeding resistance.
This is where the bear call spread becomes relevant.
A bear call spread is a defined-risk options strategy that benefits when price:
It consists of:
This structure introduces several advantages:
Most importantly, it aligns with the current market condition:
We are not attempting to call a top—we are positioning around the idea that resistance may hold.
Trade Construction (Case Study)
Let’s break down the structure illustrated in the chart.
This creates a vertical spread positioned above current price, allowing the trader to collect premium while defining risk.
Key Components:
The breakeven sits above the current resistance zone, which is a crucial element of the setup.
This means price would need to:
…all before expiration, in order for the position to move into a loss.
This positioning introduces a favorable structure:
The strategy is not dependent on being “right” about direction—it is dependent on price behavior relative to resistance.
Risk Profile Explained
The payoff profile of a bear call spread is asymmetric but controlled.
From a scenario perspective:
This is where structure matters more than prediction. The goal is not to anticipate exact price movement, but to define acceptable outcomes ahead of time.
Forward-Looking Trade Idea (Illustrative Case Study)
This case study illustrates how such a structure could be approached.
While the reward may appear smaller than the risk, it is important to consider the probability distribution. The strategy is designed to benefit from a wide range of outcomes, not just a single directional move.
This highlights a key principle in options trading:
Structuring trades around probabilities could potentially be more effective than relying on precise forecasts. Ultimately this depends on the trader’s style.
Contract Specifications
Understanding contract specifications is essential for proper risk management.
E-mini Dow Jones Industrial Average Index Options:
Risk Management: The Real Edge
No strategy, regardless of structure, replaces the need for disciplined risk management.
Key considerations include:
Managing a spread is not just about holding to expiration. In many cases, traders may:
Consistency in execution often matters more than individual outcomes.
Key Takeaways
Chart Reference
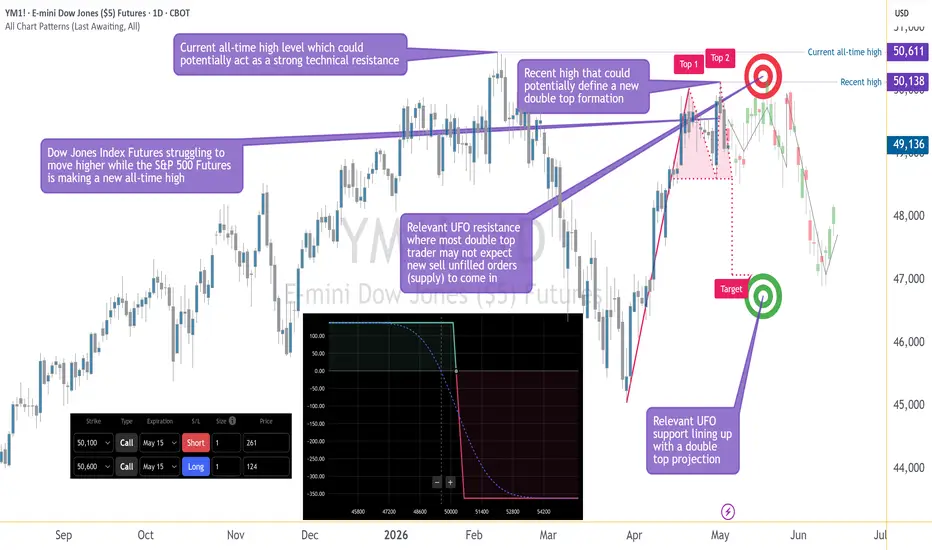
The chart provided illustrates:
These elements collectively support the structured approach discussed.
Data Consideration
When charting futures, the data provided could be delayed. Traders working with the ticker symbols discussed in this idea may prefer to use CME Group real-time data plan on TradingView: tradingview.com/cme/ - This consideration is particularly important for shorter-term traders, whereas it may be less critical for those focused on longer-term trading strategies.
General Disclaimer
The trade ideas presented herein are solely for illustrative purposes forming a part of a case study intended to demonstrate key principles in risk management within the context of the specific market scenarios discussed. These ideas are not to be interpreted as investment recommendations or financial advice. They do not endorse or promote any specific trading strategies, financial products, or services. The information provided is based on data believed to be reliable; however, its accuracy or completeness cannot be guaranteed. Trading in financial markets involves risks, including the potential loss of principal. Each individual should conduct their own research and consult with professional financial advisors before making any investment decisions. The author or publisher of this content bears no responsibility for any actions taken based on the information provided or for any resultant financial or other losses.
Markets rarely move in isolation. One of the most informative signals available to traders is not just price direction, but how one market behaves relative to another. This concept, known as relative weakness, becomes especially relevant when one index pushes into new highs while another fails to confirm.
In the current environment, we observe a divergence: while one major equity benchmark continues to explore higher ground, another is struggling to reclaim prior highs. This lack of confirmation is not just noise—it reflects underlying differences in participation, sector rotation, and institutional positioning.
From a behavioral standpoint, when a market fails to print new highs while its peers do, it often implies:
- Sellers are active at higher levels
- Buyers are less aggressive compared to other indices
- There is an existing overhead supply that has yet to be absorbed
This creates a subtle but important shift: instead of chasing upside continuation, the focus transitions toward areas where price may encounter resistance.
Technical Framework: Resistance and Double Top Dynamics
The chart structure reveals a potential double top formation, a pattern that signals repeated rejection at similar price levels. However, it is critical to move beyond textbook definitions and focus on why this matters.
A double top is not simply two peaks—it represents:
- A failure to auction higher
- A reinforcement of seller dominance near resistance
- A buildup of supply above current price
In this case, resistance should not be treated as a single price, but rather as a zone. This zone sits above the recent high and extends into the area approaching the all-time high. Within this region, prior activity suggests the presence of UnFilled Orders (UFOs)—areas where selling pressure previously exceeded buying interest.
This is where many participants make a critical mistake: assuming that once price revisits resistance, it will break. In reality, markets often require multiple attempts to absorb supply, and until that happens, resistance remains structurally relevant.
The key takeaway here is simple:
- Price is trading below a well-defined resistance zone
- The structure reflects relative weakness
- The probability distribution favors non-breakout scenarios unless proven otherwise
Strategy Selection: Why a Bear Call Spread?
Given this backdrop, directional trading becomes less attractive than structured positioning. Instead of relying on a strong downward move, the objective shifts toward capturing value from price not exceeding resistance.
This is where the bear call spread becomes relevant.
A bear call spread is a defined-risk options strategy that benefits when price:
- Moves lower
- Moves sideways
- Moves slightly higher but remains below a defined level
It consists of:
- Selling a call option (closer to price)
- Buying a further out-of-the-money call option (protection)
This structure introduces several advantages:
- Defined risk: Maximum loss is known from the start
- Time decay (theta): Works in favor of the position
- Flexibility: Does not require precise directional timing
Most importantly, it aligns with the current market condition:
We are not attempting to call a top—we are positioning around the idea that resistance may hold.
Trade Construction (Case Study)
Let’s break down the structure illustrated in the chart.
- Expiration: Mid-May
- Short Call Strike: Near the resistance zone
- Long Call Strike: Above the resistance zone
This creates a vertical spread positioned above current price, allowing the trader to collect premium while defining risk.
Key Components:
- Credit Received: 137 points
- Maximum Risk: 363 points
- Breakeven Level: 50,237
The breakeven sits above the current resistance zone, which is a crucial element of the setup.
This means price would need to:
- Break resistance
- Sustain above it
- Continue higher
…all before expiration, in order for the position to move into a loss.
This positioning introduces a favorable structure:
- If price stalls → premium decays
- If price pulls back → position benefits
- If price rises modestly → still within acceptable range
The strategy is not dependent on being “right” about direction—it is dependent on price behavior relative to resistance.
Risk Profile Explained
The payoff profile of a bear call spread is asymmetric but controlled.
- Maximum Gain: The premium collected
- Maximum Loss: The defined spread width minus the credit
- Breakeven: Strike of short call + credit received
From a scenario perspective:
- Scenario 1 — Price Moves Lower: The spread rapidly approaches maximum gain as both options lose value.
- Scenario 2 — Price Moves Sideways: Time decay gradually erodes option premiums, favoring the position.
- Scenario 3 — Price Moves Slightly Higher: As long as price remains below breakeven, the structure remains intact.
- Scenario 4 — Price Breaks Resistance Strongly: The position moves toward maximum loss, which is predefined and capped.
This is where structure matters more than prediction. The goal is not to anticipate exact price movement, but to define acceptable outcomes ahead of time.
Forward-Looking Trade Idea (Illustrative Case Study)
This case study illustrates how such a structure could be approached.
- Entry Consideration: As price approaches or reacts within the resistance zone
- Target Outcome: Expiration below breakeven level, allowing full premium capture
- Stop-Loss Consideration: A sustained move above resistance, indicating invalidation of the thesis
- Reward-to-Risk Ratio: Approximately 0.37:1 based on the structure
While the reward may appear smaller than the risk, it is important to consider the probability distribution. The strategy is designed to benefit from a wide range of outcomes, not just a single directional move.
This highlights a key principle in options trading:
Structuring trades around probabilities could potentially be more effective than relying on precise forecasts. Ultimately this depends on the trader’s style.
Contract Specifications
Understanding contract specifications is essential for proper risk management.
E-mini Dow Jones Industrial Average Index Options:
- Tick size: 1.00 index point = $5.00
- Margin: Currently ~$15,000 per contract
Risk Management: The Real Edge
No strategy, regardless of structure, replaces the need for disciplined risk management.
Key considerations include:
- Position sizing: Never allocate excessive capital to a single idea
- Defined exits: Know when the trade thesis is invalidated
- Time awareness: Options lose value over time, but adverse moves can accelerate losses
- Diversification: Avoid concentration in highly correlated positions
Managing a spread is not just about holding to expiration. In many cases, traders may:
- Close early to lock in partial gains
- Reduce exposure if conditions change
- Adjust positions if necessary
Consistency in execution often matters more than individual outcomes.
Key Takeaways
- Relative weakness provides insight into underlying market structure
- Resistance zones are more meaningful than single price levels
- Bear call spreads allow for structured, defined-risk positioning
- Profitability is not dependent on sharp downward movement
- Risk management remains the cornerstone of any strategy
Chart Reference
The chart provided illustrates:
- A potential double top formation
- A clearly defined resistance zone
- Alignment with UFO-based supply areas
- A projected downside target
These elements collectively support the structured approach discussed.
Data Consideration
When charting futures, the data provided could be delayed. Traders working with the ticker symbols discussed in this idea may prefer to use CME Group real-time data plan on TradingView: tradingview.com/cme/ - This consideration is particularly important for shorter-term traders, whereas it may be less critical for those focused on longer-term trading strategies.
General Disclaimer
The trade ideas presented herein are solely for illustrative purposes forming a part of a case study intended to demonstrate key principles in risk management within the context of the specific market scenarios discussed. These ideas are not to be interpreted as investment recommendations or financial advice. They do not endorse or promote any specific trading strategies, financial products, or services. The information provided is based on data believed to be reliable; however, its accuracy or completeness cannot be guaranteed. Trading in financial markets involves risks, including the potential loss of principal. Each individual should conduct their own research and consult with professional financial advisors before making any investment decisions. The author or publisher of this content bears no responsibility for any actions taken based on the information provided or for any resultant financial or other losses.

Trade Smarter — See What Most Traders Don’t. Explore AutoClimate™ and AutoUFOs® (patented) in the UFO Trading Suite: tradingview.com/spaces/traddictiv/
Related publications
Disclaimer
The information and publications are not meant to be, and do not constitute, financial, investment, trading, or other types of advice or recommendations supplied or endorsed by TradingView. Read more in the Terms of Use.
Trade Smarter — See What Most Traders Don’t. Explore AutoClimate™ and AutoUFOs® (patented) in the UFO Trading Suite: tradingview.com/spaces/traddictiv/
Related publications
Disclaimer
The information and publications are not meant to be, and do not constitute, financial, investment, trading, or other types of advice or recommendations supplied or endorsed by TradingView. Read more in the Terms of Use.