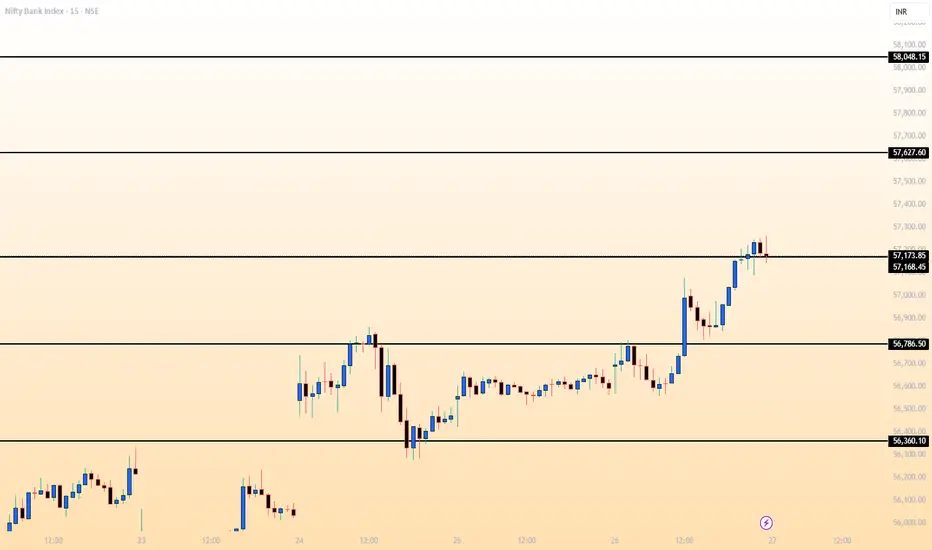
BNAKNIFTY MATHEMATICAL LEVELSThese Levels are based on purely mathematical calculations.
How to use these levels :-
* Mark these levels on your chart.
* Safe players Can use 15 min Time Frame
* Risky Traders Can use 5 min. Time Frame
* When Candle give Breakout / Breakdown to any level we have to enter with High/Low of that breaking candle.
* Targets will be another level marked on chart
* Stop Loss will be Low/High of that Breaking Candle.
* Trail your SL with every candle.
* Avoid Big Candles as SL will be high
AB=CD
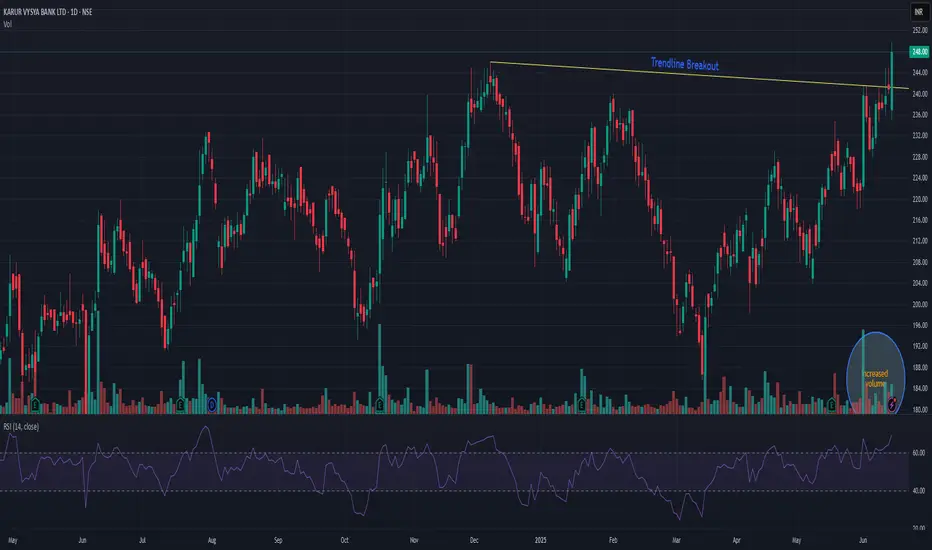
KARURVYASYAKARURVYSYA has given trend-line breakout. The stock is continuously making higher high and higher-low pattern with increased market participation. Also it crossed previous resistance level as well. It seems like it will continue its momentum ride. The stock is trading at ATH. Closing below 220 may change my view. It may face resistance nr 285 levels.
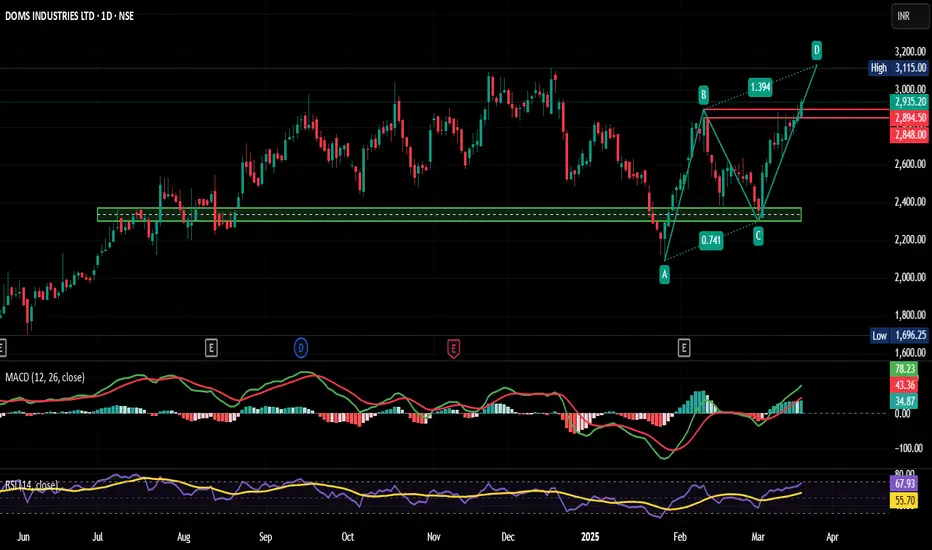
DOMS - ABCD Pattern, Crossing Swing Highs.NSE:DOMS Crossing Swing Highs with Strong Candles With RSI and MACD Trending Upwards and according to ABCD Pattern it's Likely to Cross ATH in Short Term.
About:
Incorporated in 2006, NSE:DOMS is a stationery and art product company primarily engaged in designing, developing, manufacturing, and selling a wide range of these products under the flagship brand, NSE:DOMS is the 2nd largest player in India’s branded 'stationery and art' products market. It held 29% and 30% market share for it
Maruti SuzukiMaruti Suzuki India Ltd - Technical Analysis & Trade Plan
Stock: MARUTI SUZUKI INDIA LTD (NSE)
Timeframe: 1D (Daily)
Key Levels:
Entry Zone: Near 10,369 - 10,278
Stoploss: Below 9,815 (Candle Close Only)
Immediate Support: 10,800
Immediate Breaking Range: 11,837.90
Immediate Resistance: 12,376.65
Target 1: 13,445.70
Target 2: 14,957.60
Trade Plan:
Good Accumulation Zone Identified at lower levels.
Demand Zone around current price, expecting potential reversal.
If price holds the demand zone, a
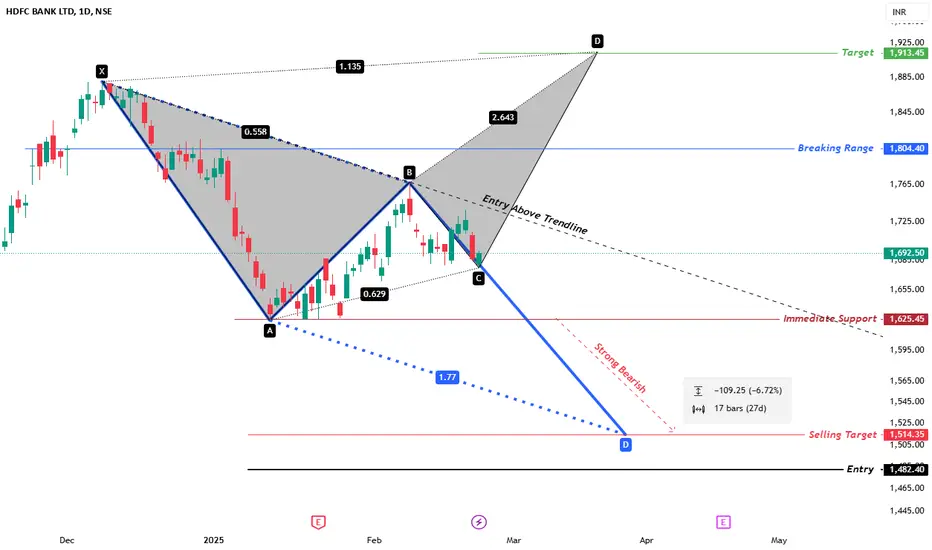
HDFC BANK LTD (NSE)📢 Smart Trading Opportunity – HDFC BANK LTD (NSE) 📢
🚀 Maximize Profits with a Strategic Approach! 🚀
Unlock potential trading opportunities with well-defined entry, target, and risk management strategies.
🔹 Bullish Pattern & Entry Plan
🔹 Entry Confirmation – Above Trendline Break
🔹 Target – ₹1,913.45 (Projected Upside)
🔹 Breaking Range – ₹1,804.40 (Key Resistance)
🔹 Risk-Reward Management – Optimize with stop-loss adjustments
🔻 Bearish Scenario & Downside Plan
🔻 Immediate Support – ₹1,625.45
🔻
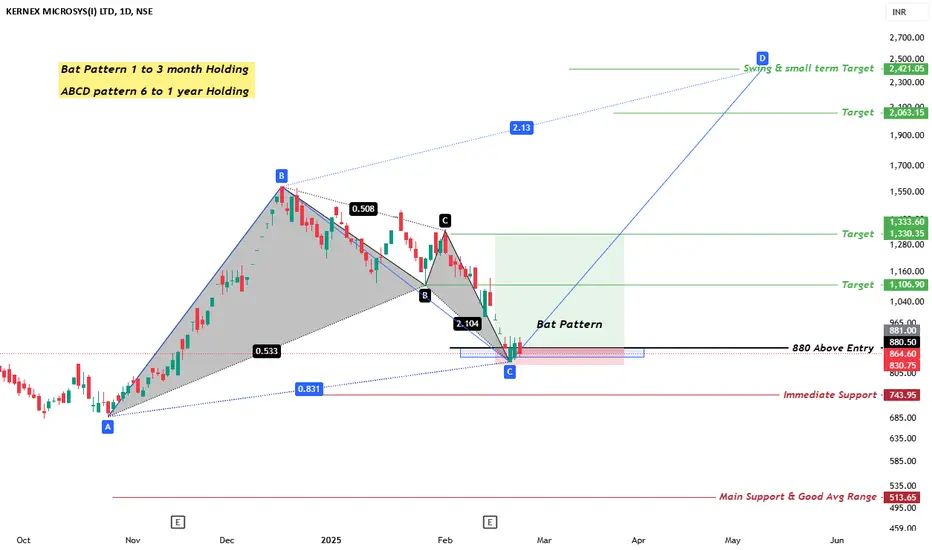
Kernex Microsys (KERNEX) Short term (6 to 12month) HoldingSL Weekly candle close only, Target Trigger Price
All detail for chat. good entry at mark price only. and must stoploss minimum risk and good profit. risk ratio 1:1 to manage modified SL. This is not call, Just my idea. Please understand your risk and take full responsibility of your actions
USD/INR - Where the rupee is heading, Will it reach the 90s?FX_IDC:USDINR
Looking at the daily chart of USD/INR we can see a breakout at 86.68 level. And now there is a retracement from 87.95 levels. The question is whether it will make a new high or not, should we remain bullish on USD?
Let's refer the history to find a high probability answer.
From Oct'18 prices consolidation for 1.5 years. During this period there was cup and handle (C&H) formation followed by a breakout in Feb-20 @72.5 INR.
Note that the base of the handle was at 70.55 INR.
Gold Next Move SL 1Hr candle close only, Target Trigger Price
All detail for chat. good entry at mark price only. and must stoploss minimum risk and good profit. risk ratio 1:1 to manage modified SL. This is not call, Just my idea. Please understand your risk and take full responsibility of your actions
Aarti IndustriesSL 1Hr candle close only, Target Trigger Price
All detail for chat. good entry at mark price only. and must stoploss minimum risk and good profit. risk ratio 1:1 to manage modified SL. This is not call, Just my idea. Please understand your risk and take full responsibility of your actions
Maruti Suzuki SL 1Hr candle close only, Target Trigger Price
All detail for chat. good entry at mark price only. and must stoploss minimum risk and good profit. risk ratio 1:1 to manage modified SL. This is not call, Just my idea. Please understand your risk and take full responsibility of your actions
Technical trading part 2Technical analysis is a trading strategy used by investors to identify new investment possibilities. To anticipate future price movements of stocks or other assets, for example, past price and volume data is studied and shown on graphic charts, where trends, patterns, and technical indicators can be identified.
Two Possibilities in NIFTYWhile Considering the Positive Outlook first to satisfy our souls and urge to see NIFTY in Green; I found a Butterfly Pattern with a possibility of reaching out to 24857.75, B Leg.
On other hand if there is any negative news spreading out and FII are good enough to bargain best price they may take this up to 21653.30 creating a downtrend in NIFTY forming AB=CD Pattern
All these are approximate levels.
I am not a SEBI Certified RA. This Idea is completely educational based on Harmonic Technic
Classic head & shoulder now 1473 looks attractive Natco PharmaHi Investor,
Chart looks attractive stock near 52 week's high. Today pharma index supporting advise.
Stop loss and target as mentioned on chart. Correction done in Natco pharma.
Inverted Head & shoulder is formed when recent down trend gets reversal.
In Natco Pharma same condition is forming.
Have Patience to wait in the stock with strict stop loss.
I or you never know future it is just projections of future.
Trade at own risk I am not advisor better Observe stock performance to gain in future
AB = CD Apple: Daily Vision
The trend is clearly bullish, and selling in this context could be risky. However:
Resistance Break: The price recently broke a resistance level (red zone / white arrows) but has not yet performed a pullback.
Scenario to Watch: If the price returns to the support/polarity zone, it could offer a potential buying opportunity to aim for an AB = CD pattern.
Key Points:
Uncertainty: It’s unclear whether the price will pull back to the support zone or reach the target directly wit
SYNGENE INTERNATIONAL A STOCK IN MOMENTUM Syngene International Ltd. is an interesting chart in momentum with following
1. RSI on all time frames (DWM) above 60
2. Narrowing Bollinger Bands on daily chart with price walking on upper band
3. Huge Anchor candle formed on weekly chart with high volume
4. Major price supports
20 SMA (daily) 883
50 EMA (daily) 875
20 SMA (Weekly) 864
Super Trend (daily) 864
with cluster of supports in zone of 864 to 885 and Fibonacci extension targe
#NIFTY - 14TH NOVEMBER NSE:NIFTY
#NIFTY ⚡
Observe, understand, then implement 👍🏻
Chart contains support and resistance levels (understand how it works 👇🏻)
Support and resistance are key concepts in technical analysis used to identify potential price levels where assets may reverse or stall.
Support:
-Definition: A support level is a price point where buying interest is strong enough to overcome selling pressure, preventing the price from falling further.
- Indicators: Support levels can be identifie
elliotwaves study ERIS LIFESCIENCESof the 5 waves corrective wave 3-4 and impulse 4-5 is pending. the final cycle in this stock can be expected to be complete by Jan2029 as it is cyclical in nature. We can confirm as long as wave 4 doesn't cross wave1.
The company is a leading player in the domestic branded formulations market. It is the youngest among the top 20 companies in the Indian Pharmaceutical Market.
The company focuses on branded generics, with 85% in chronic and 15% in acute segments. It offers drugs across various th
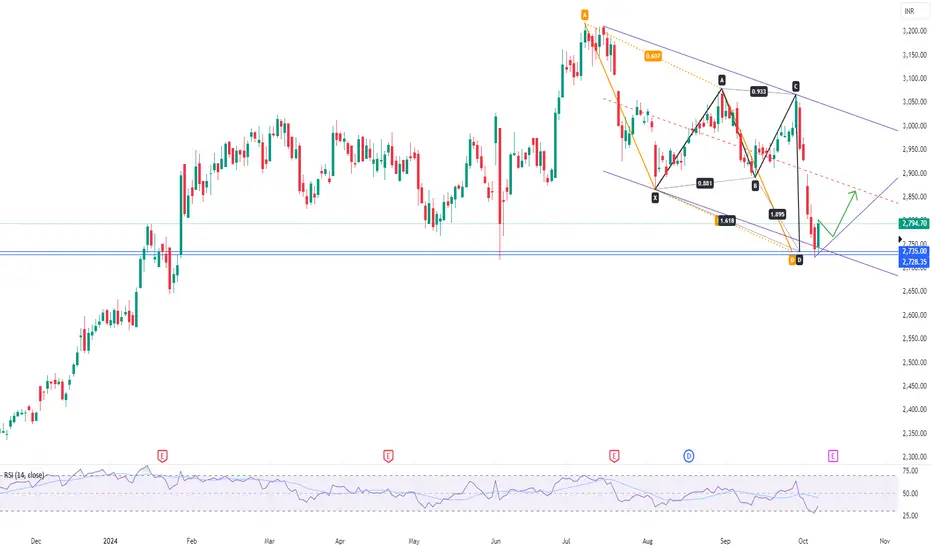
Reliance Industries - Double Bottom & Channel SetupReliance Industries reversing from double bottom & channel levels which confluences with AB=CD & Deep Crab harmonic reversal zones
Entry after retraces to 2760 levels with target near mid trendline of channel. Exit if price settles below 2720 levels.
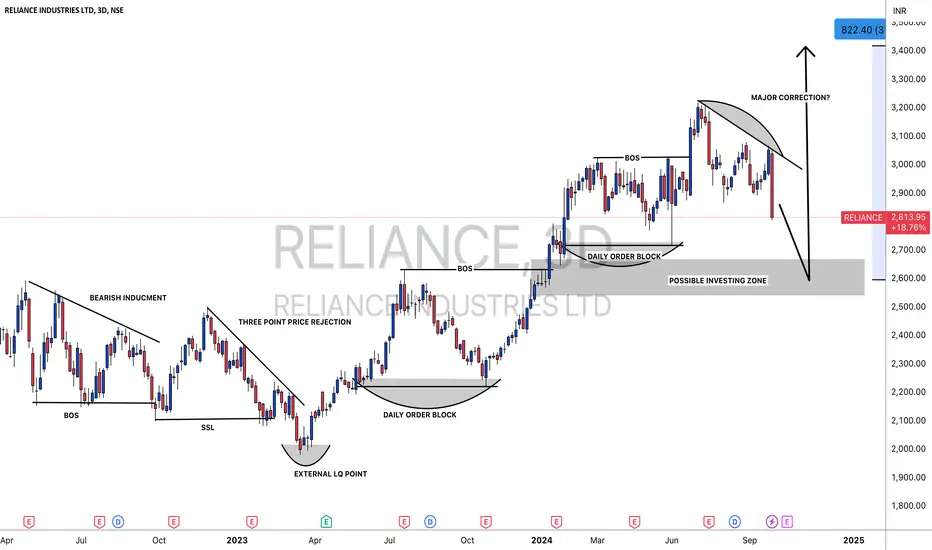
#RELIANCE: Big Investment Opportunity In Making±Dear Traders,
We are seeing some major correction on Reliance since last few weeks, in our technical view price is yet to drop further towards our designated buying zone. Expect a swift buy from our identified key level, even possible to see a continuous bull run taking price above 3500 region. If you agree to our view please like and comment for more.
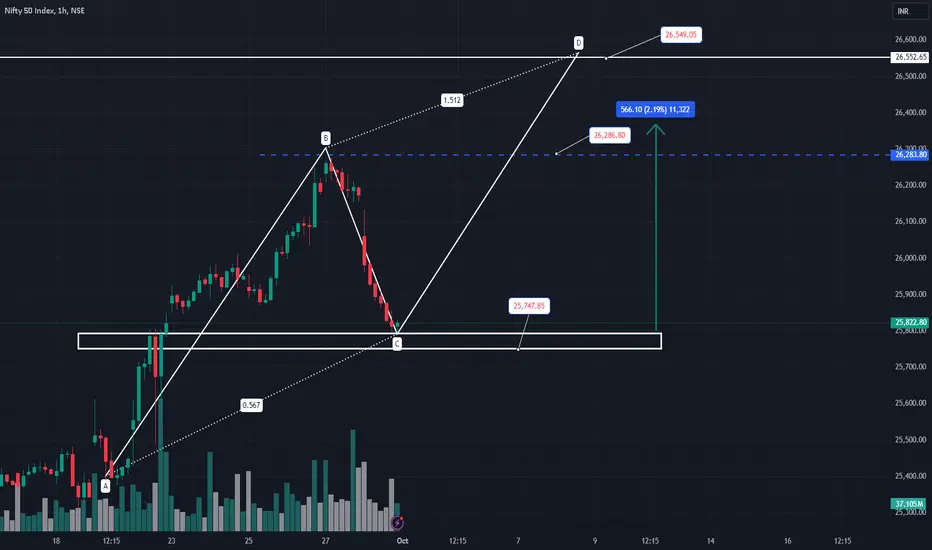
NIFTY LEVL FOR COMING DAY$The ABCD pattern is a popular intraday chart pattern used in technical analysis to predict potential price movements. Here’s a breakdown of the pattern:
A: The stock experiences a morning rally to a new high.
B: This is followed by a midday pullback and consolidation.
C: The stock forms a higher low and begins to grind up, breaking through the morning high.
D: Finally, the stock rallies to a new high of the day12.
This pattern helps traders identify entry and exit points, manage risk, and avoid
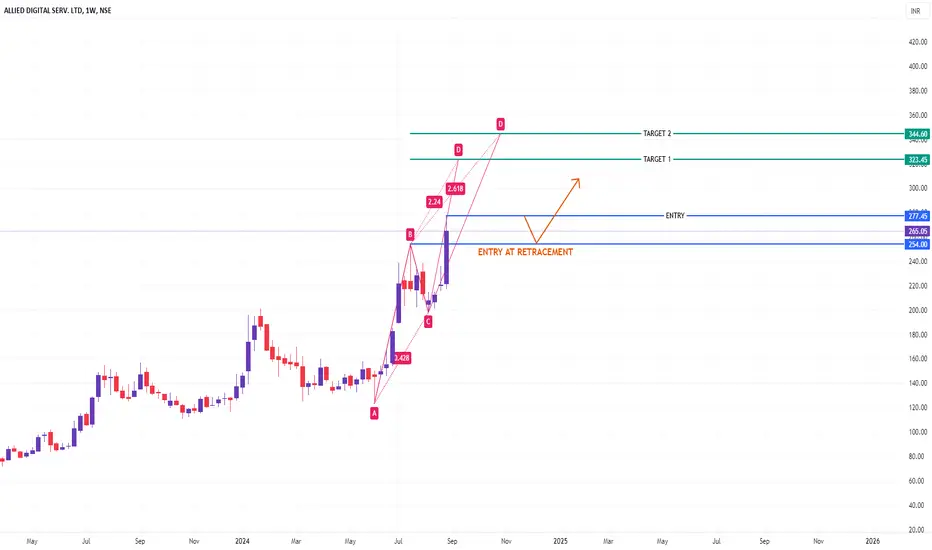
ANOTHER RALLY IN ADSL?"ADSL" is now getting ready for another rally in making a new ATH. There is a good short-to-mid term swing opportunity in this stock, but before this, we need to plan our entry. Two levels of entry is possible here:
a. The stock is undergoing a retracement in a lower timeframe (hourly), which should retest the previous resistance level of 254. A good entry should be at the time of retest which gives us a good risk-to-reward ratio.
b. Another entry, which is in fact a more generic and safe, is