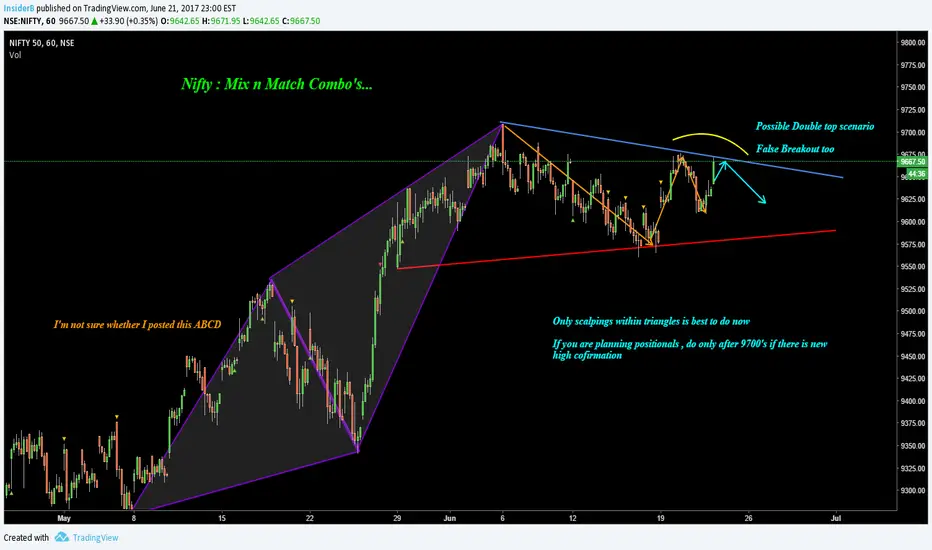
Nifty : Mix n Match Combo'sThere is an ABCD, there is a triangle formation in development, one potential Double top which is evolving within triangle.. yea... We have various pattern styles in single chart of Nifty. Versatility in one word.
We have good triangle formation, most of you might have found earlier itself & we are expecting a false breakout on the upper trendline with Double top to move down later in the day or 2mrw. WHY ?! Whenever there is less volatility, big funds gets active bcos that's the time they can
AB=CD
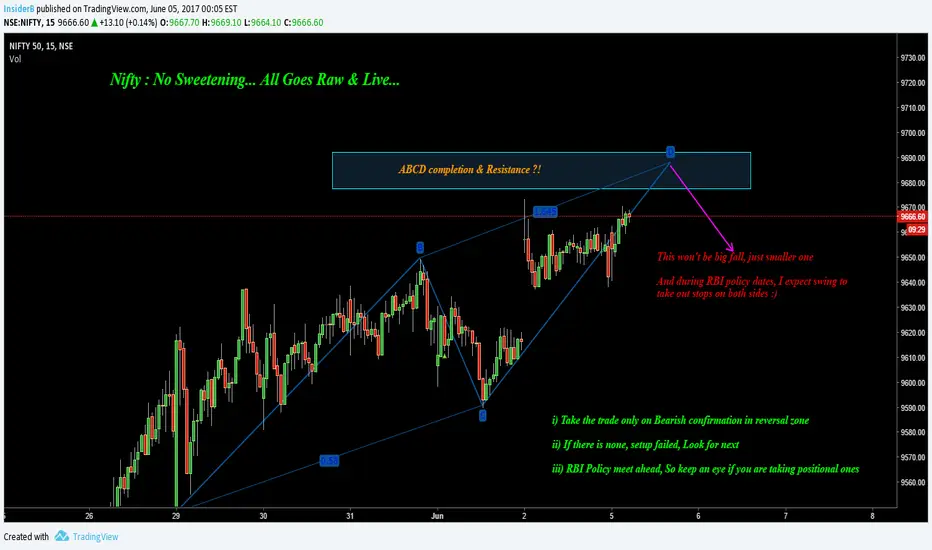
Nifty : No Sweetening it... Raw & Live !Any of you missed the rants ? Well,It has been 6 months or so, since I went on for that, actually from last week I was about to do that but postponed it as, why should I do ?! Now it brewed up & filled the cup, brimming to overflow...I'm not gonna mince My words, there is no sweetening it anymore... All Goes Raw n Live...
Why You are Trading ?
To make money, obviously. Don't ask Me silly things - Yeah, I read your mind. But why you never cared about your bleeding ? You keep on taking trades
Nifty : Some Gyan with Gann So where to begin with ?! Let's go with analysis first then we will touch up on Gann.
Why I'm aiming the zone of Nifty 9570's, as mentioned in previous post I can see potential ABCD pattern , though its bull run it may trigger downmove a smaller relief rally of 100 points. Apparently, we are aiming at 9750's zone for this bull run target zone, if My guess is right true & to this profile name, an Insider info, Institutions will slowly build up their short positions from 9600's to 10000's, one of
Nifty : ABCD..ABCD..More of ABCD !Yep, ABCD's everywhere you go, repetitively thats why Kindergarten Admission confirmed & on lighter note some people maturity level is also upto KG levels only, trying to nag others & to pick up fight. Well, I'm supercool now, than ever :)
Expecting Bat formation on hourly, keeping in view of our 9k fill, this needs to fail, probably a small short covering can happen around ABCD completion zone in Nifty 9070's zone. But if Nifty gets in Bear mood today,it will turn ruthless & filling all the ga
Nifty : Aaluma Doluma Aisalakadi Maluma !Happy Guys & I don't know what to give as title, so gave a song title :)
Getting Back to analysis, we drew ABCD yesterday, there can be more reasons coming up today for upside move. For example, Am expecting Double Bottom on 15mins time frame but will see whether it happens. I hope Nifty, after taking support around 9130's zone we may get move up till 9170's zone.
Let's see how this ABCD pattern completion works for Nifty, a gap up ? Hmm possible.. !
Last minute add, I forgot whom but someone
Short MindTree : Raining repetitive ABCD's !Though there is potential chance of pullback in Mindtree upto 445's, chances are bleak. Once the day close below 435 happens, it will race down till 410. Note, how well it aligns with ABCD pattern, when the pattern gets completed in our zone it forms another harmonic pattern around 410 zone.
Anyway go down on lesser timeframes & check for potential selling chances to get into trade n ride till 410 :)
MShort
ABCD Pattern - Educational series 1Hi All ,
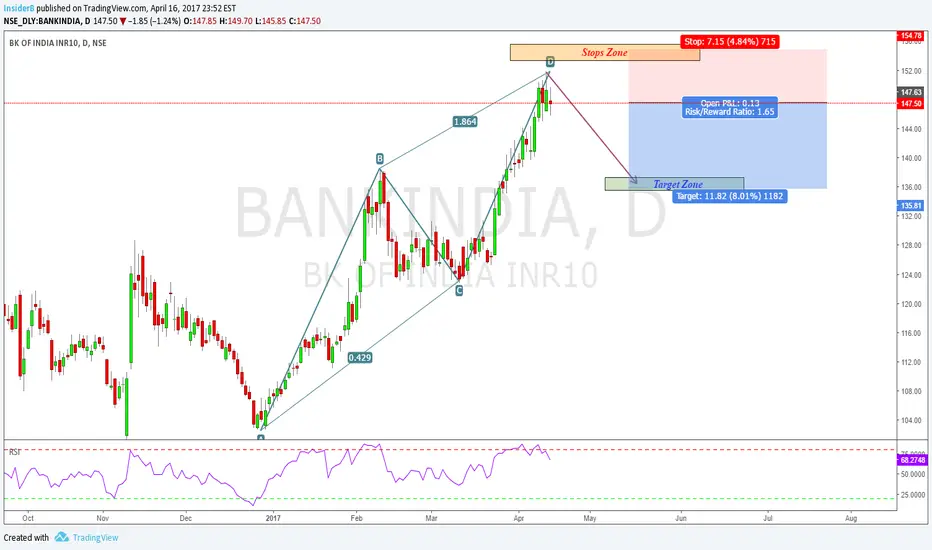
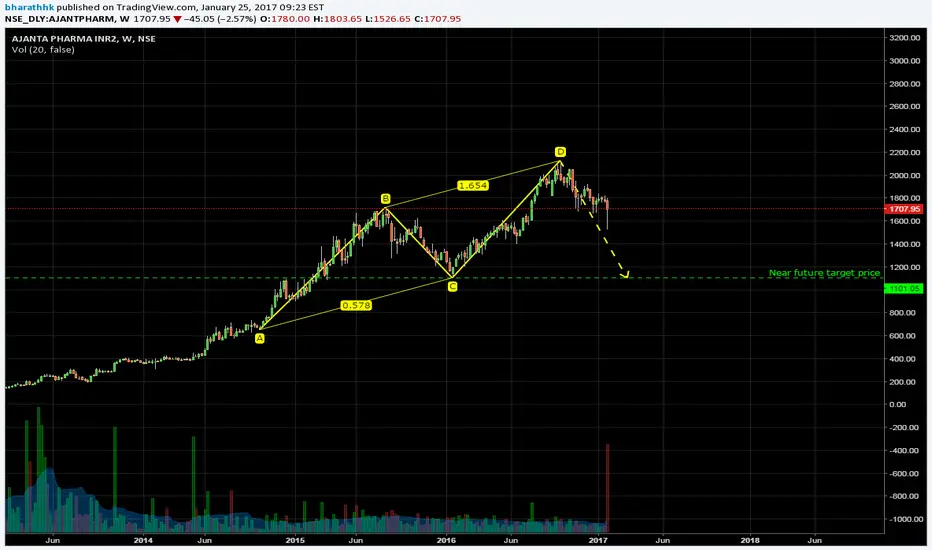
I'm just sharing info on pattern : ABCD pattern where price moves down from A to point B than rises to point C and again falls to point D , AT point D we can look out for potential reversal .
1)Lets say AB is down leg , And BC is retracement which is 0.618 or 0.786 of AB
i.e Length or height of BC = ( 0.618 or 0.786 ) x length of AB
2) After BC leg there is another leg down CD which is 1.27 or 1.618 of BC
i.e Length or height of CD = (1.27 or 1.618 ) x
Bullish Harmonic Pattern - NTPC (4Hrs)Hello Traders,
I have spotted Bullish BAT pattern on NTPC. Potential Reversal Zone (PRZ) is highlighted on the chart. This time, we have little wide PRZ. It is made of 1.27AB, 0.886XA and BC Fibonacci ratio confluence. Once price enters into the PRZ, one can take a long entry. This potential swing trade has a risk/reward ratio of 1:1.4 for Target-1 and 1:2.3 for Target-2.
Follow this idea for further updates.
Happy Trading!
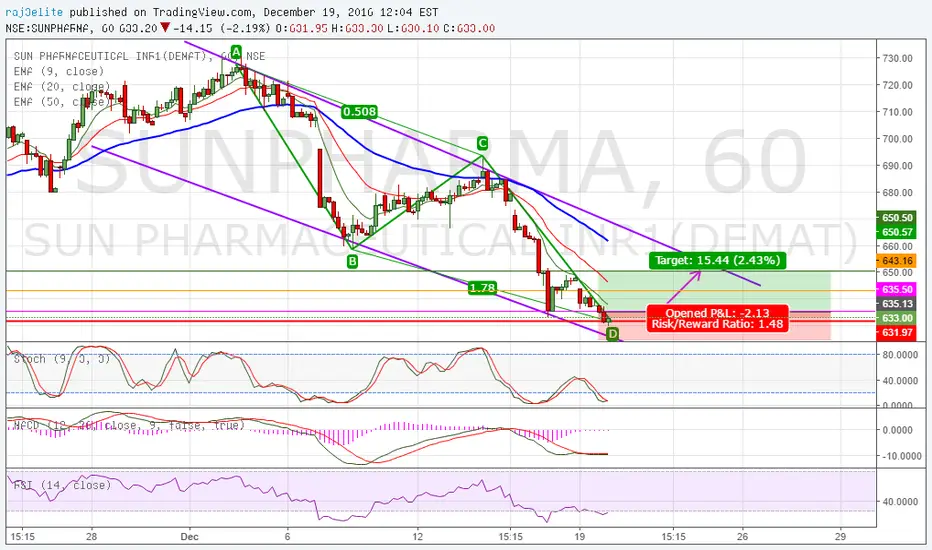
ABCD Triangle formation on BPCL - LONGTechnical Analysis:
RSI above 50.
MACD on bullish crossover and Histogram on above '0' line.
Stochastic on bullish but in overbought level, so may be take some time to make correction.
Price lying above the EMA 50 and EMA 5/20 bullish crossover.
Trade:
Buy above - 631
Target 1 - 637
Target 2 - 642
Stop Loss - 625
Reward Points - 11
Risk Points - 06