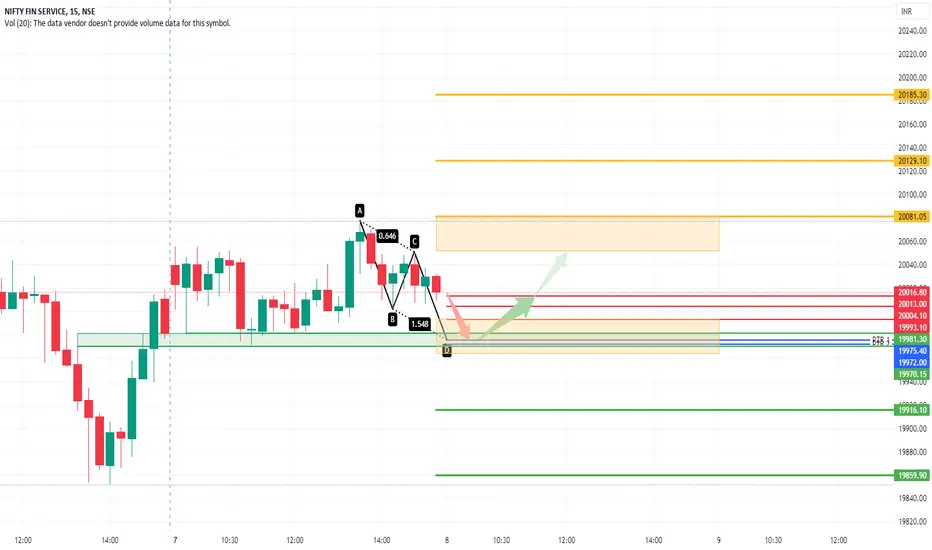
AB=CD
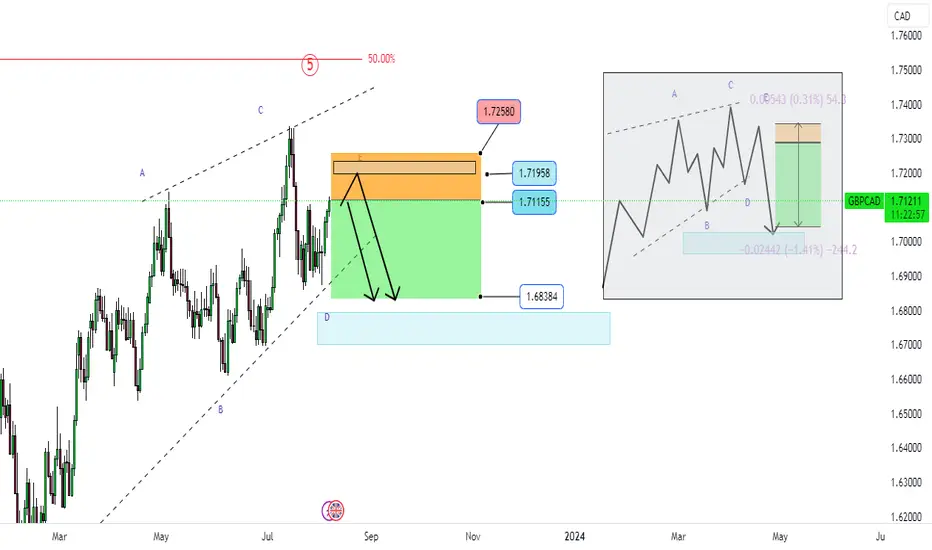
GBPCAD ANALYSIS 4H Trade Idea:
📍 Entry: 🎯 Target: ⛔ Stop Loss: (MARKED IN CHART)
💡 RISK REWARD 1 : 3
💰 Risk 1% of your trading capital.
⚠️ Markets can be unpredictable; research before trading.Disclaimer: This trade idea is based on Elliott Wave analysis and is for informational purposes only. Trading involves risks; seek professional advice before making any financial decisions.Informational onLY !!!!AND IF YOU WANT TO LEARN IT WHAT STOPPING YOU TO ASK HOW ?
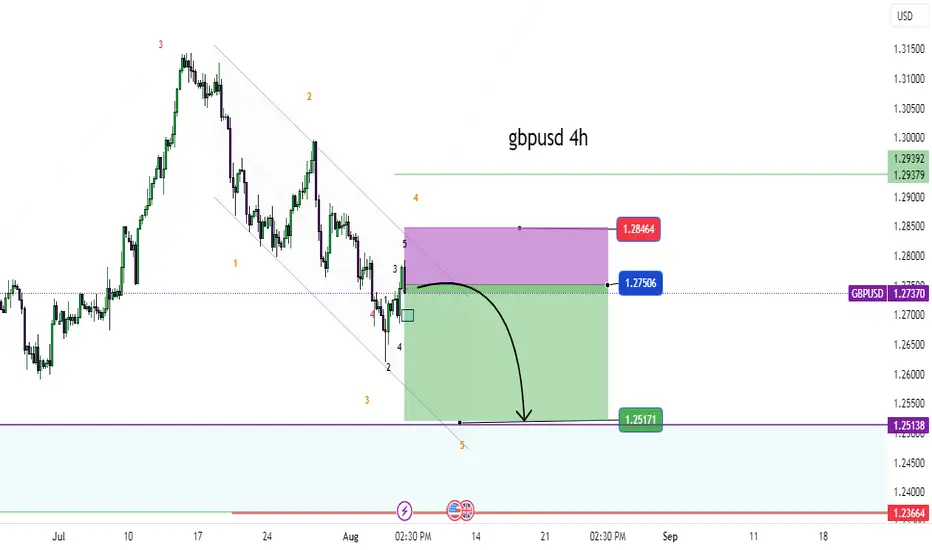
GBPUSD - BUY Trade Idea:
📍 Entry: 🎯 Target: ⛔ Stop Loss: (MARKED IN CHART)
💡 RISK REWARD 1 :
💰 Risk 1% of your trading capital.
⚠️ Markets can be unpredictable; research before trading.Disclaimer: This trade idea is based on Elliott Wave analysis and is for informational purposes only. Trading involves risks; seek professional advice before making any financial decisions.Informational onLY !!!!AND IF YOU WANT TO LEARN IT WHAT STOPPING YOU TO ASK HOW ?
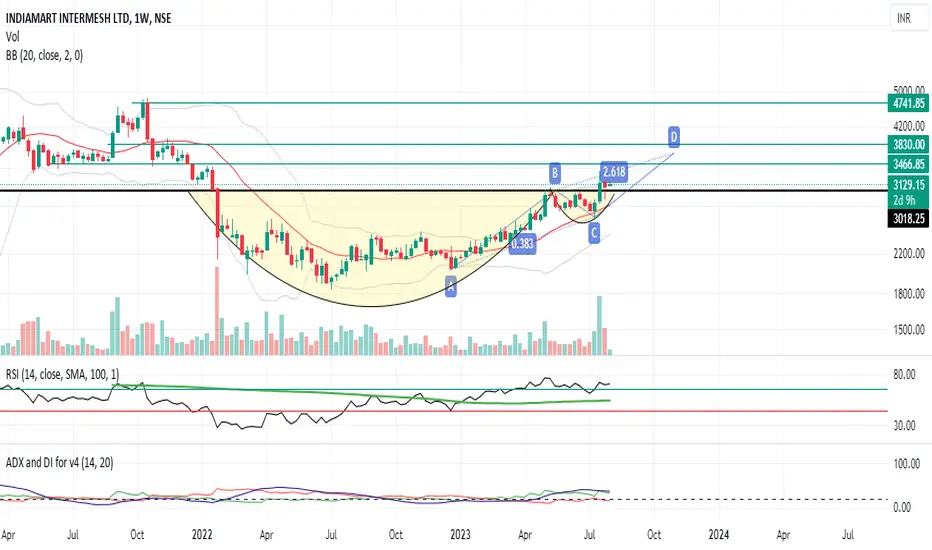
INDIAMART bullish - CUP and handle (WEEKLY) TGT 3460 - 3830Looking Bullish
1. Cup and handle pattern on weekly chart
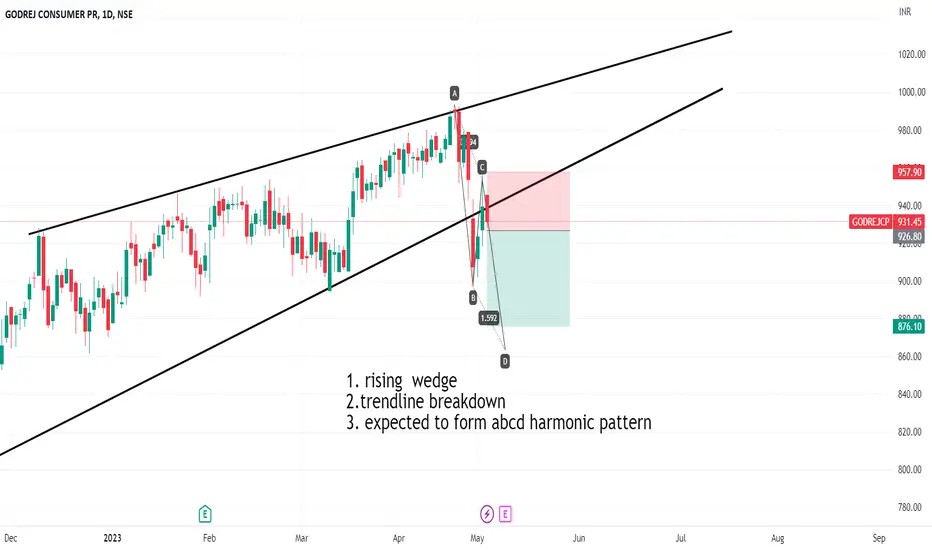
2. ABCD pattern on Daily chart
3. Daily / weekly/ monthly RSI above 60
Buy on Dips with SL below 2810 for a target of 3466- 3830
I am not an expert, I just share interesting charts here, Please seek expert opinion before investing, because investment in share market is subject to market risks
SIEMENS india abcd pattern buy on dips for 3950-4110Siemens india near break out of Symmetrical Triangle on daily and weekly charts
1. Weekly / Monthly RSI Abv 60
2. Harmonic Patter ABCD
3. Major Support near 3630
Buy on Dips with Tgt 3950- 4100- 4310- 4550 (positional)
Stock taking 20SMA support.
I am not an expert, I Just share interesting charts here. Please take expert opinion before investing as investment in stock market is subject to market Risks
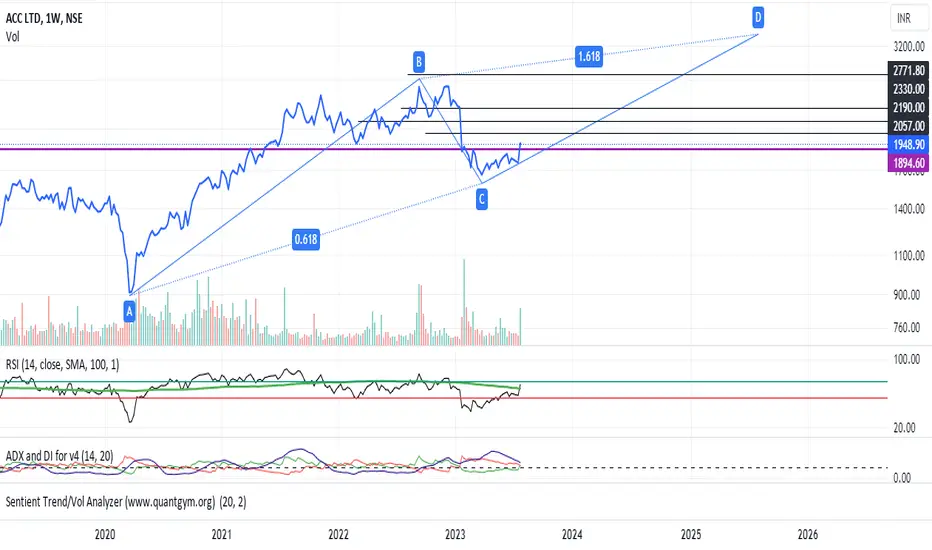
ACC Harmonic ABCD Pattern on Weekly chart tgt 2057-2130ACC is looking bullish on daily and weekly charts
1. Formed ABCD pattern on weekly chart
2. Weekly close above Upper Bollinger band
3. Narrowing Bollinger Bands
4. Daily RSI Above 60
5. Daily Ascending Triangle Breakout at 1848 levels
5. Price Above 20 SMA (weekly)
Strong Support at 1870-1820 zone.. Buy on dips for a positional target upto 2130 (minor resistance near 2097 levels) and Investment Target of 3200 +
I am not an expert I just share interesting charts here, Please seek expert adv
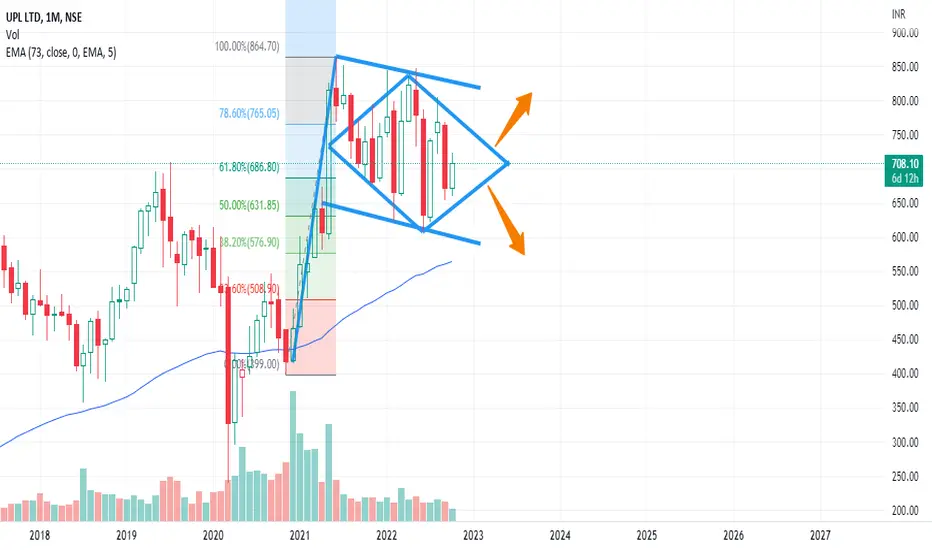
UPL Wait for BreakoutUPL on Monthly longer time frame is creating multiple pattern on various charts.
Two significant pattern visible is Flag pole and Diamond pattern.
Hence it can breakout on either side
If breakout on upper side then target of 991 is expected
If breakout on lower side then target of 508 is possible.
currently good for trading the range unless breakout occurs and sustains on closing basis.
Data Patterns LongTime Frame - 3-4 Weeks
Potential TGT - 2450
Given the swing low was not broken
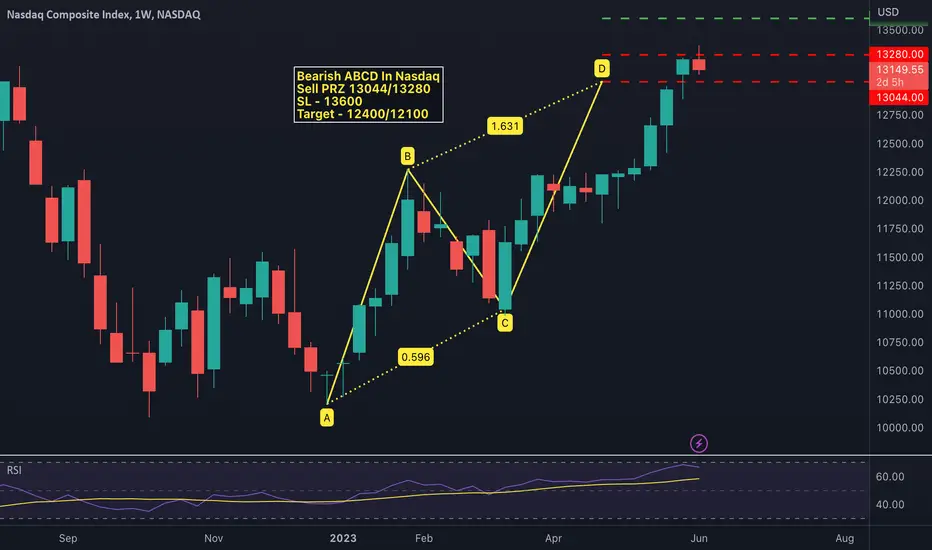
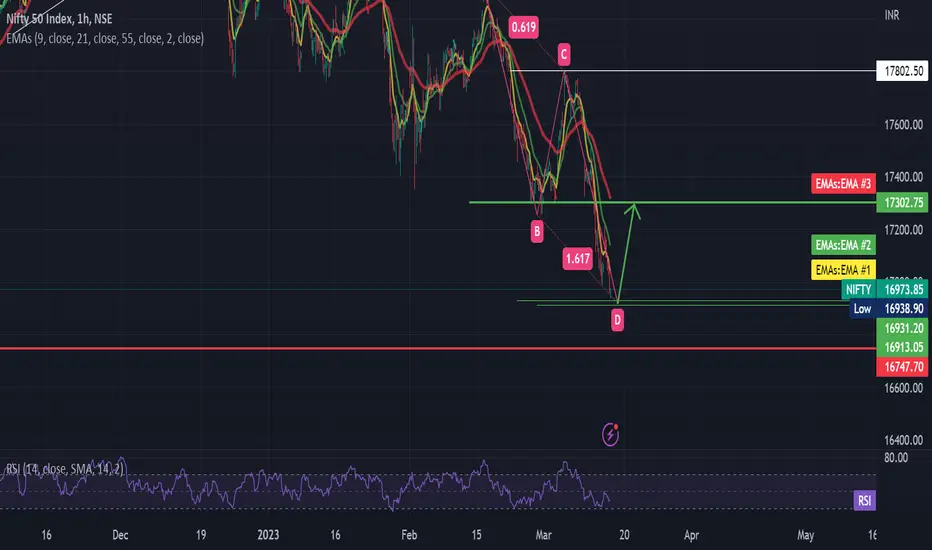
Analysis: Based on the historical candles the AB=CD pattern was always had PRZ (Potential Reversal Zone) at 1.618 fibonacci level, assuming there are very high chances to repeat the same.
Note: This analysis is for education purpose only...
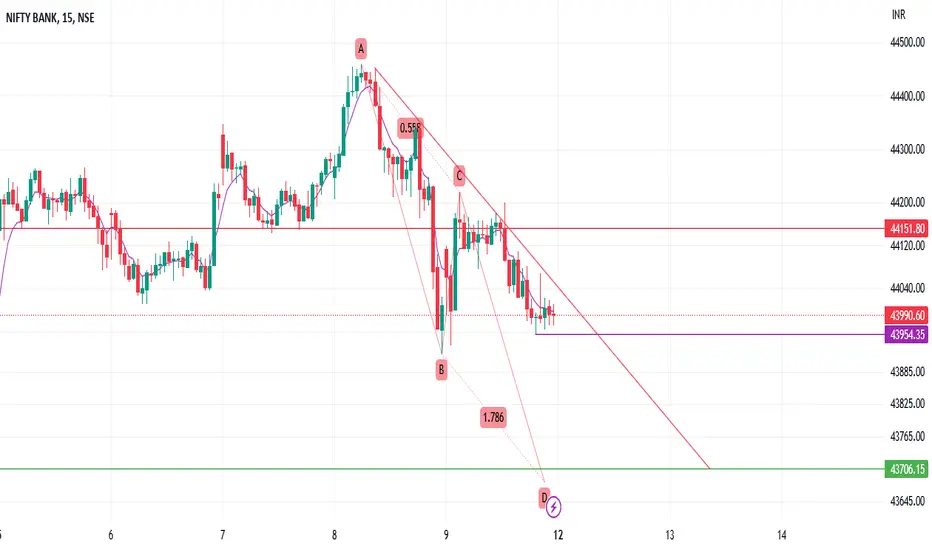
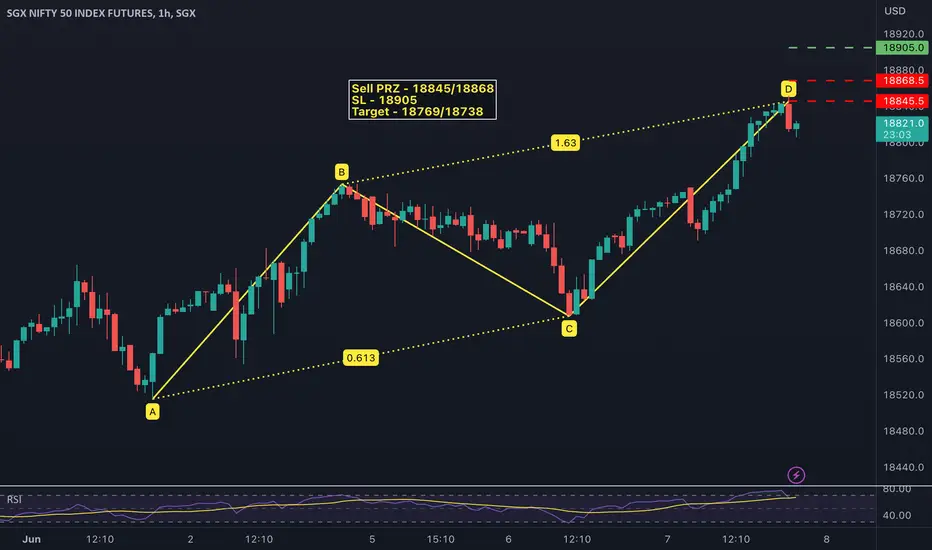
Nifty Short opportunity Hello Trader,
I wanted to inform you about a potential short opportunity in Nifty. The market is currently forming an AB = CD pattern, which indicates a possible downward movement in the near future.
The critical level to watch for this short opportunity is 18822. Once the price reaches or approaches this level, it could be an opportune time to consider initiating a short position.
Remember to perform your own analysis and closely monitor the market before making any trading decisions. Stay u