FIB Macro Retracment and long again BTC needs to retrace after 100% top in order to continue going upby weirdnemo314
HAL - ABCD bearish harmonic patternThis is purely technical analysis and educational in nature ! Recommendation: This is just a potential ABCD bearish Pattern. If the candle on 10th March 2023, is bearish with huge volume then there is a strong chance to short your trade. Also, look for any double tops or other indicators to support this bearish trend. Note: Target 1 , Target 2 and Stop Loss is mentioned in the chart. Buy must be at the D Point for short trade. Optional Reading Below ------------------------------ 1) What is aShortby URANOUSCOLDUpdated 1
Bullish ABCD pattern in NiftyBullish ABCD pattern in Nifty (SL on 15 min. candle close) PRZ for Buy 16918 SL 16800 Target : 17750, 18100 CMP 16972.15 @ March 15, 2023 Chart by CA Savita RehlanLongby UnknownUnicorn87777330
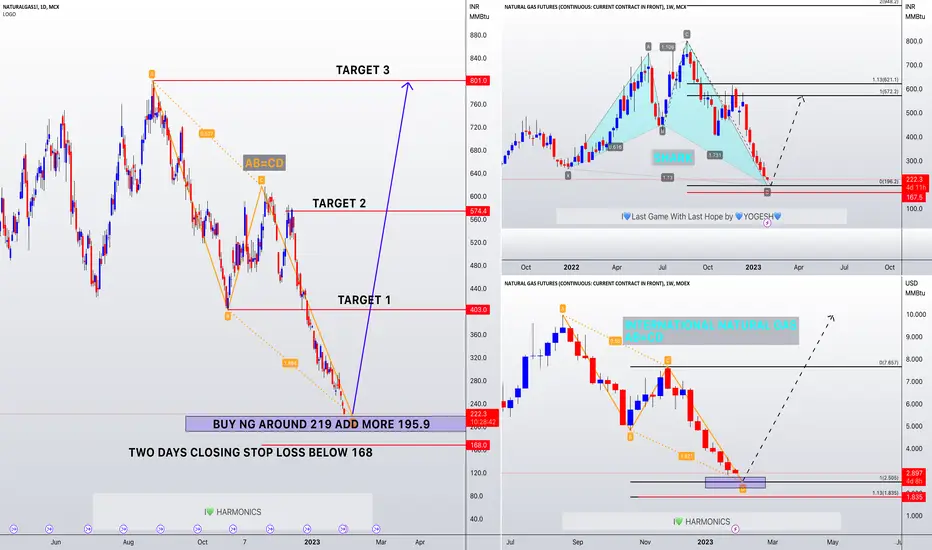
natural gas (ng) mcx ab=cd with shark harmonic pattern Natural gas forming ab=cd harmonic pattern with shark harmonic pattern . that pattern indicate =BUY natural gas between 221-19 add more 195.9 two days closing 168 below target 403-574-801 we kept two days closing stop loss just bcoz of weekly time frame.. above 247 closing will take sharp move for 300-403 around 403 should partial booking can consolidated or reverse from there for retrecment . 2 days close above 403 is non stop target will life time high ... if all set then should not go and Longby YOGESH_KUMAWATUpdated 515
ASTEC LIFESCIENCES - LONG TERM - HARMONICSPotential Bullish AB=CD harmonic pattern. Resistance marked basis on current swings fib retracement. Supports marked on the basis of Fib extensions. If 1538 is broken, next support will be 1493.Longby KunalSaxena10Updated 1
Tech Mahindra - Target 2000+Chart prediction is on Monthly charts and long term view if it follows this pattern Similar to Wipro even Tech Mahindra is probably making diamond chart pattern. The Fibonacci retracement support is taken at 78 percentile and consolidating since couple of months. The Long term target in 1 to 1.5 years is 2000+ Go long once the stock closes above 1165 on monthly basis. Stop Loss is 940 on monthly closing basis.Longby Sandeepk3148
Reliance completed ab=cd harmonic pattern @channel Reliance completed ab=cd harmonic pattern @channel bottom trendline buy reliance 2381 above add more on EVERY dip till 2267 CLOSING STOPLOSS BELOW 2230 TARGET WILL 2498-2613-2736 more idea link attached below check and comments Longby YOGESH_KUMAWATUpdated 13
Reliance forecast - 2558 possibleThis is possible forcasting and not a confirmed trade On a daily chart a bullish diamond formation is forming and yesterday an inverted candle has formed on charts indicating possible reversal. If this continues uptrend then 2558 target is possible in coming few weeks. SL is 2290 on closing basis. Longby Sandeepk31Updated 5
TORRENT POWERTorrentpower sell below 474 add more 493 closing sl 515 tg 439-395 then will buy with butterfly @ 395 add more 372 closing sl 367 tg 439-474 -515++ ab=cd, and butterfly formation we doing trade for d point after crossing b point coz already triangle breakdown and bearish bat pattern@ top and trading below 200 ema TShortby YOGESH_KUMAWATUpdated 18
Niftyintraday nifty ab=cd @ 15 min short @ below 18139 add more 18184 stoploss above 18207 target 18097 17982-17886-17820Shortby YOGESH_KUMAWATUpdated 7
HDFCAMCHDFCAMC Result comming soon chart have trendline support also forming ab=cd BUY @ 1987-62 CLOSING STOPLOSS BELOW 1918 TARGETS =2122-2222-2300Longby YOGESH_KUMAWAT6
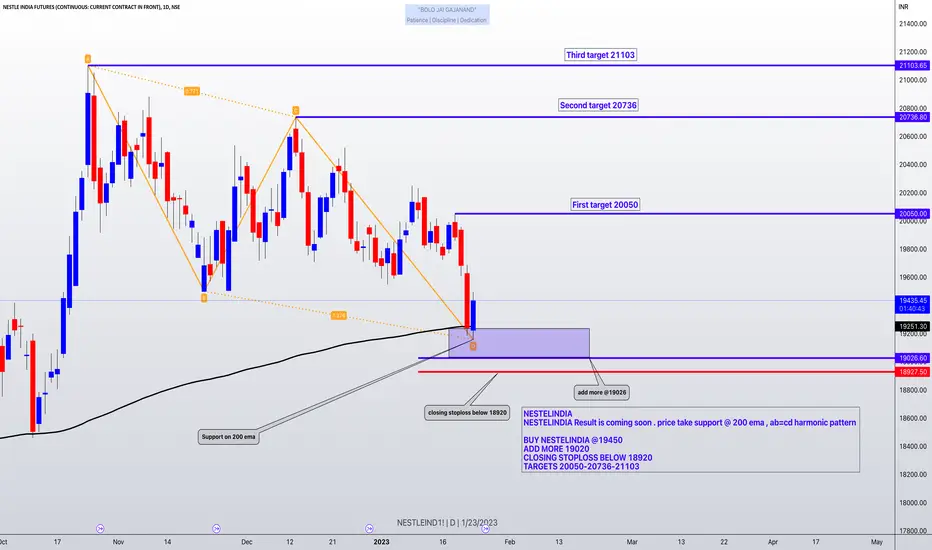
NESTELINDIA NESTELINDIA NESTELINDIA Result is coming soon . price take support @ 200 ema , ab=cd harmonic pattern BUY NESTELINDIA @19450 ADD MORE 19020 CLOSING STOPLOSS BELOW 18920 TARGETS 20050-20736-21103 BOLO JAI GAJANANDLongby YOGESH_KUMAWAT6
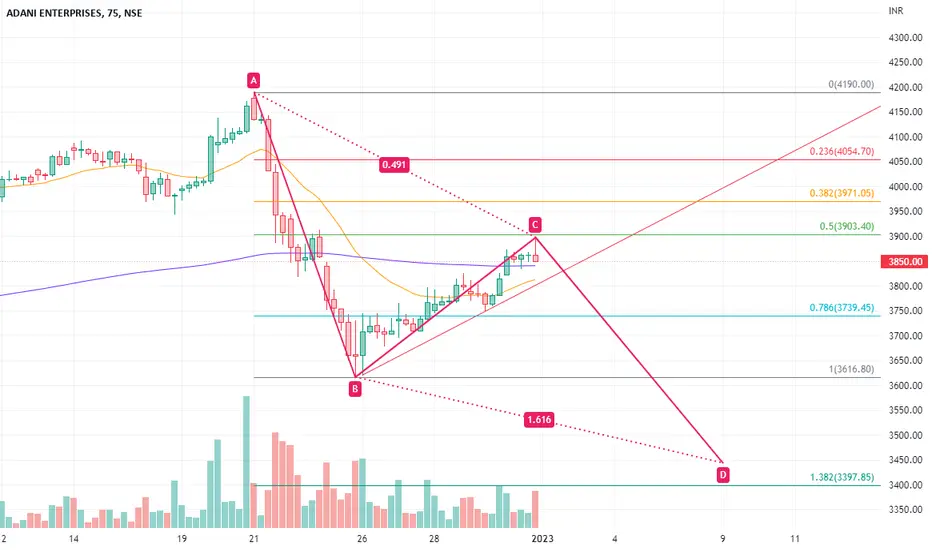
AdaniEnt ABCD PatternTime frame used 75 Minutes. ABCD pattern as per Fib retracement price has taken rejection at 0.5% level my view is negative with target towards Point D. View fails if price crosses and closes above 3904 level.Shortby VikasRanjaneUpdated 1011
#Reliance AB=CD Pattern#Reliance AB=CD Pattern PRZ-2406-2362 CMP:2444.10 @ 16 Jan 2023Longby Harmonic_Pattrens9
TataChem looking good for shortTataChem looking good for short, ABCD pattern formed also it has taken rejection from AVWAP(Pink color line) on Daily Time frame. Also Fib Retracement level of 50% at reversal. 3 confirmations.Shortby VikasRanjaneUpdated 40
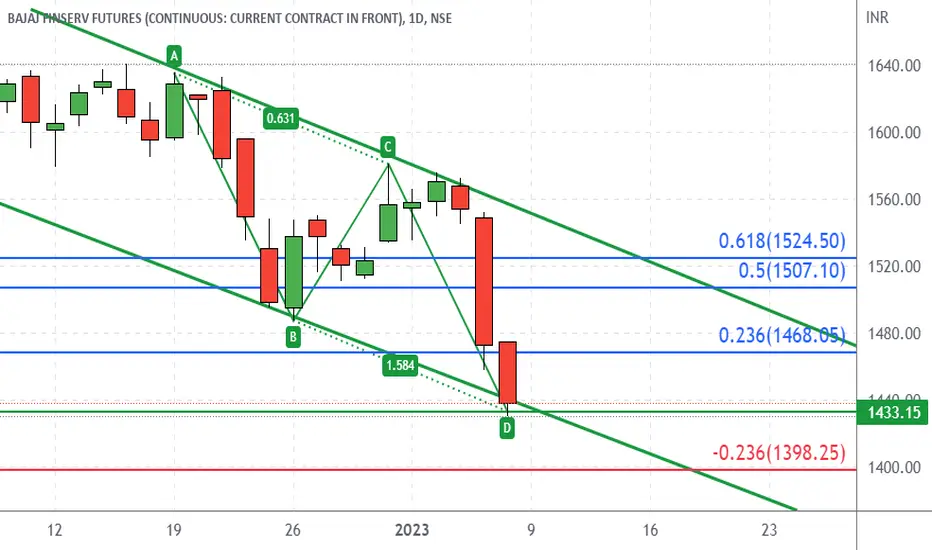
Bullish ABCD in Bajajfinsv 8-1-2023It is Bullish ABCD pattern seen daily tf can give good reversal from 1433 zone marked in the chart. Note: Always try to find a good price action patterns or any candle stick patterns in marked zones in smaller timeframe to take entry with small stop loss. (Color code for horizontal lines: Green - Buy, Blue - targets, Red - SL). If any doubt for take entry in price action patterns, please ask in comment box, i will try to help. Disclaimer: Im not tip provider and this chart is not indented toLongby Elango-ragavan2
SBI Lifeay go upward till 1286 SL 1255 in week timeAs per Harmonic PRZ pattern, SBI Life may go up till 1286 SL 1255 Longby SumtinathInvestments24
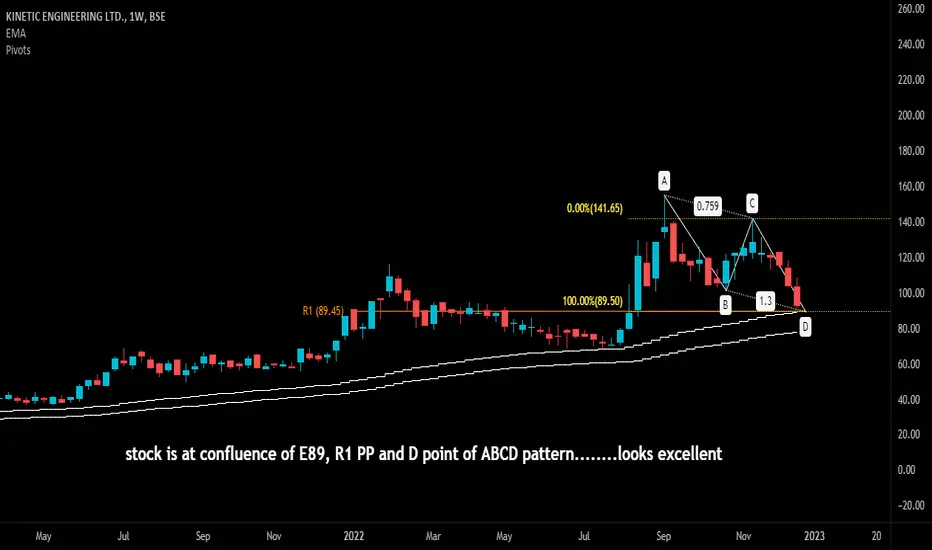
KINETIC ENGINEERING is at excellent supportstock is at confluence of E89, R1 PP and D point of ABCD pattern........looks excellentLongby Nattyshotstocks0
Tilak Nagar Industries Ltd (TI): Double Bottom PattenNSE:TI is showing bullish price actions: Technical Reasons: A double bottom W patten is created Tried to see if it's a Harmonic XABCD patten, not fully complying with this Volume is going up, Current trend is uptrend Strong Momentum: Price above short-, medium- and long-term moving averages Fundamental Reasons: 1. FII / FPI or Institutions increasing their shareholding 2. Negative to Positive growth in Sales and Profit with Strong Price momentum 3. Highest Recovery from 5Longby pradipandsuvra0
HDFCLIFE price studyPrice action to watch . Possibility price to reach 510 if break below trend line. Possible sell trade entry at CMP 540 with SL above 545. In case of gapup, we could wait and observe if price closes again below trend line. old demand zone below 510Shortby seaHPUpdated 0
MARUTI SHORTEntry price: 8780 SL - 8830 Target - 8715 Note: View shared for educational purpose only. Conduct your due dilligence before making any trading/investment decisions.by yaashul0
Nifty analysis for 8th JulyThe real test now starts for Nifty. It has escaped 0.5 retracement by a huge gap up opening and now it has to face 0.618 retracement. If Nifty becomes lucky for the second consecutive time then 16250-16350 will be the key test. So do long very carefully.by debabratamath0
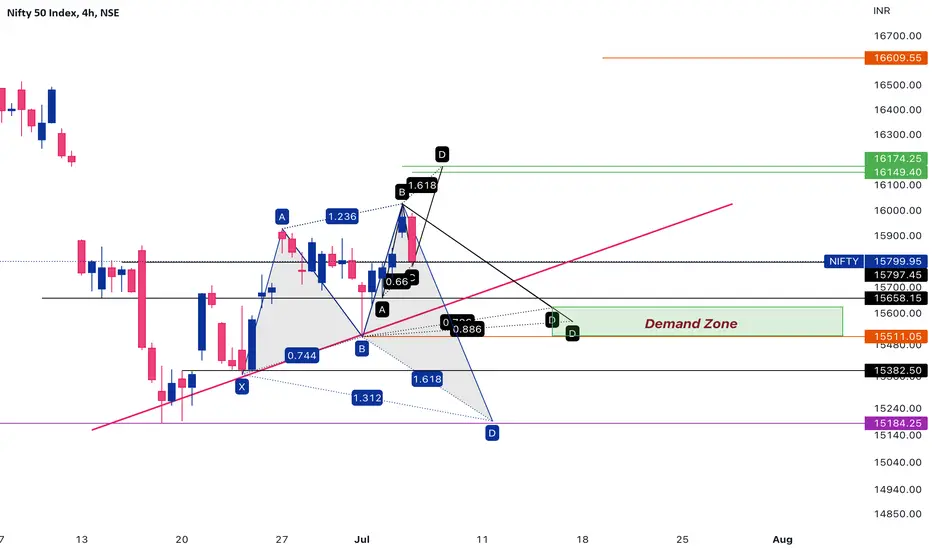
Nifty 7th July ExpiryHere we have analysed Nifty50 index in 4H TF. If it breaks 16511 then XABCD will be activated and we can again come back to 15200 level. On the higher side 16600 to 16500 will act as a strong Demand zone as it has multiple strong PRZ there. Nifty can only recover if this range is respected.by debabratamath2
Aarti Industries AnalysisAarti industries is a fundamentally strong bullish stock is in the best possible correction zone following the three drive pattern. As per my analysis this is the best time to buy as it is near 1.618 retracement phase.Longby debabratamath0

 Short
 Long
 Long
 Long
 Long
 LongLongShort
 Long
 Long
 ShortLong
 Short
 Long
 Long
 Long
 Long
 Short

 Long