BTC looks Bearish , levels are posted below.If Day closing below 40990 38330 & 36732 are upcoming Targets by nagarajanm19860
NIFTY SHORT IDEA. PRICE ACTION ANALYSISNifty has bounced off from the above supply turned demand zone and then closed below this zone. As observed, the price took a stop at 3.618 retracement of ABCD pattern. But looking at the DJI index, nifty is likely to open with a gap down. Here, 17400,17300, and 17200 have a good OI on the put side, meaning they are good supports. This has to be interpreted in the right way. 1) For the 17400 put writers exit, there will be a bounce if the market opens with a gap down. 2)If the price breaks Shortby Sanjan91Updated 0
NMDC levels...14.09.2021 ( D candle)NMDC forming ABCD pattern...once its break it will reach 190-200 in midterm, Keep SL 145 at D candle closing basis... BUY ABOVE 160 Onlyby albnsecurities13
Sea Pony and Sea Horse Pattern in NIFTYSea pony and Sea horse pattern is observed in Nifty. The target and stop loss levels are mentioned on the chart. Happy trading :) This is just for educational purposes.Longby Sanjan91Updated 1
Bullish AB=CD on Bharatforge 1 hr chartBharaforge potential reversal zone 778-80 can test 800 .....view negated below 770 DAILY CLOSE Thanks Jigar Pateel 8898030401by JP-PROHARMONICSUpdated 0
Exide Industries - Bullish HarmonicExplanation A - 211.5 B - 170.55 C - 199 D - ??? AB = CD 211.5-170.55 = 40.95 199-40.95 = 158.05 Our 1st Price Reversal Zone (PRZ) 158.75 which is our 2nd Price Reversal Zone is 1.41 fibo level of B To C. SL is below 1.618 fibo level of B To C. Target calculated by C To D fibo levels.Longby ShareMarketCoachUpdated 26
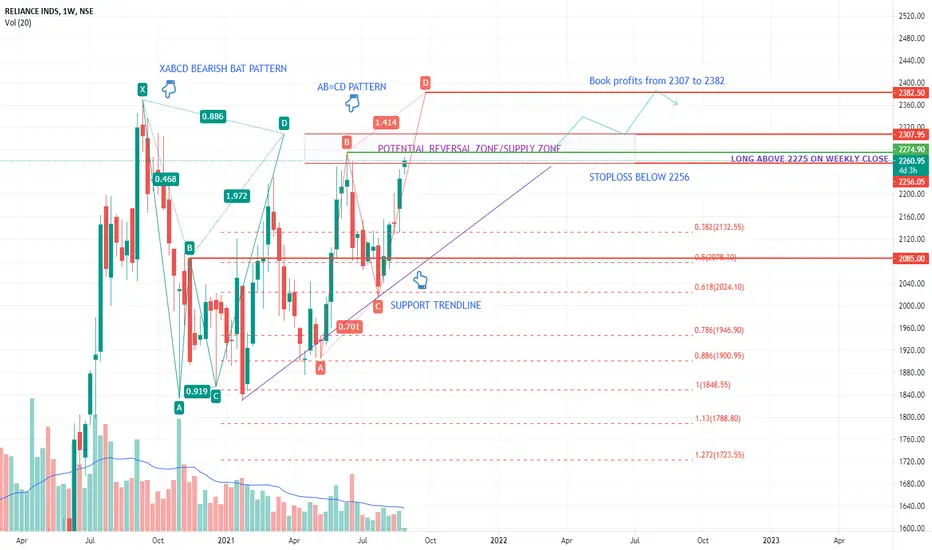
Reliance Industries price action analysisReliance Industries is currently trading at the potential reversal zone (PRZ)/supply zone set by the XABCD Bearish Bat Pattern. In the past after reaching the supply zone, it got corrected until 0.618 Fibonacci retracementent of CD. After a good correction, it is trading now near the supply zone. Since it touched the all-time highs, it never had closed above the supply zone. A daily or weekly(safe) close above 2275 could give a boost until 2307. Sustaining above this supply zone, the price maLongby Sanjan91Updated 0
NIFTY SEA PONY & SEA HORSE PATTERN IDEAThere could nice bounce in NIfty if the price manages to sustain above point C of this pattern. The targets and stop loss are mentioned on the chart. Please wait until confirmation to go long. Stop loss to be same as cost, because stop loss for momentum trade could more here. Below point D price goes to test the demand zone below.Longby Sanjan91Updated 1
DLF long candidateExpecting good upmove from current levels stoploss will be last 2 days lowLongby RUDRA007Updated 2
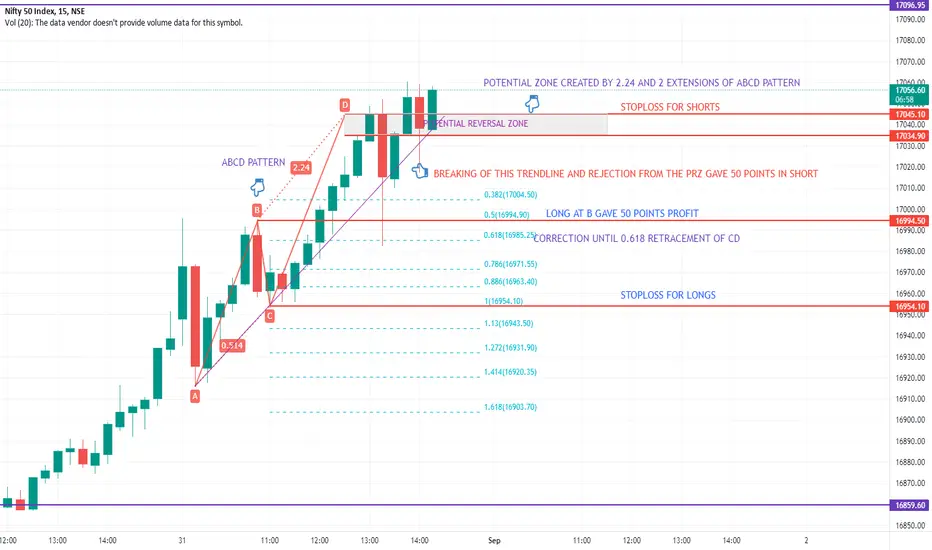
TRADE SETUP WITH ABCD PATTERN. GET YOUR SWINGS RIGHT. NIFTY50This tutorial is on the ABCD pattern and the instrument used here is Nifty 50. ABCD patterns are harmonics patterns from which swings lows and swing highs can be forecasted. The present situation is a bearish ABCD pattern. Each point denotes endpoints of the swings. A, B and C denote known swing points whereas D denotes the new swing high. The trade setup is explained on the chart for both longs and shorts. On breakout of point B, a swing high is taken out and point D would be our new swinEducationby Sanjan914
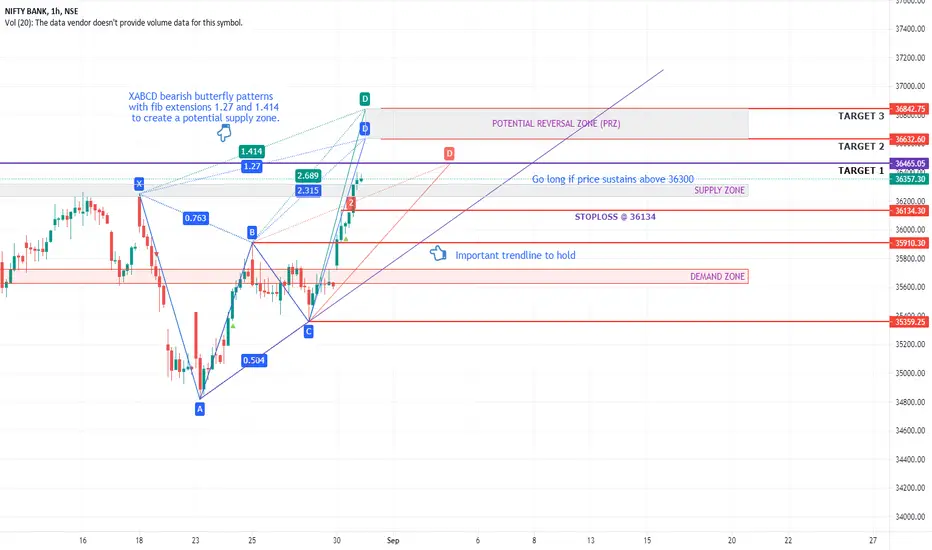
BANK NIFTY TARGET PRICE LEVELSBank nifty showed a fantastic rally after breaking the 36100 price level. If it continues to sustain above 36300, then go long. Target 1 is given by AB=CD pattern with 2 as fib extension. If bank nifty manages above target 1 then trail stop loss until target 3. Targets 2 and 3 are in the PRZ, so book your profits timely. Above this PRZ, there will be another rally with shorts covering but considering today's rally, the index may undergo consolidation or correction. Place stop loss at 36134 prLongby Sanjan91Updated 2
HUGE SHORT COVERING IN BANK NIFTY ABOVE 36100Bank nifty is at 36100. If the 36100 price barrier is taken out then a huge short covering could trigger the index's price. Go long above 36100. Book profits at the supply zone. If the price breaks the supply zone, then aim for the 36450 price level. Stoploss if the price closes below 35910. Happy trading. :) This is not an investment idea. Please consult your financial advisor before investing.Longby Sanjan91Updated 59
Bank Of Barodaa Buy At CMPBuy At cmp Stop Loss71.65(CLOSING BASIS) HEY TRADERS, THIS PREDICTION IS BASED ON A HARMONIC PATTERN AND THE HARMONIC PATTERN IS 100% ACCURATE AND10000% RISKY BECAUSE IT IS AGAINST THE TREND METHOD... HOPE YOU ALL FIND SOME VALUE Here...SO, DON'T FORGET TO LIKE AND SHARE THIS POST. DON'T FORGET TO SUBSCRIBE. COMMENTS WRITE DOWN BELOW OF THIS Chart... THANK YOU... ~Disclaimer: "I Am Not Sebi Registered Advisor" All views and charts shared in thLongby ashish_210833
Zeel Bullish Harmonic ABCD PatternZeel - Bullish Harmonic ABCD Cmp - 170.45 PRZ - 149.55 To 151.94 SL - 134.5 (Weekly Closing Basis) Target - 171/183/193Longby ShareMarketCoach12
BEARISH ABCD IN COMEX GOLD IS AHEADIf todays low is low for COMEX GOLD for next few days, we can expect a new low from 1807.7 range. SL and Targets mentioned in details. GOOD LUCKShortby Elango-ragavan2
TRANGLE & ELLIOTE WAVE PATTERN IN SNOWMAN LOGESTICS 16.08.21BUY : 45 TARGET : 89 TO 109 Reason For Buying This Script : In this script it forming triangle pattern & Elliott wave in monthly time frame. But still triangle pattern is not broken. Aggressive trader can take the trade before the breakout or else wait for breakout. Don't miss this 105% profit opportunity. Note : Above given levels are based on monthly & weekly time frame . So be patience it will take some days to achieve the target. ALL THE BEST .. Longby dayanithi55510
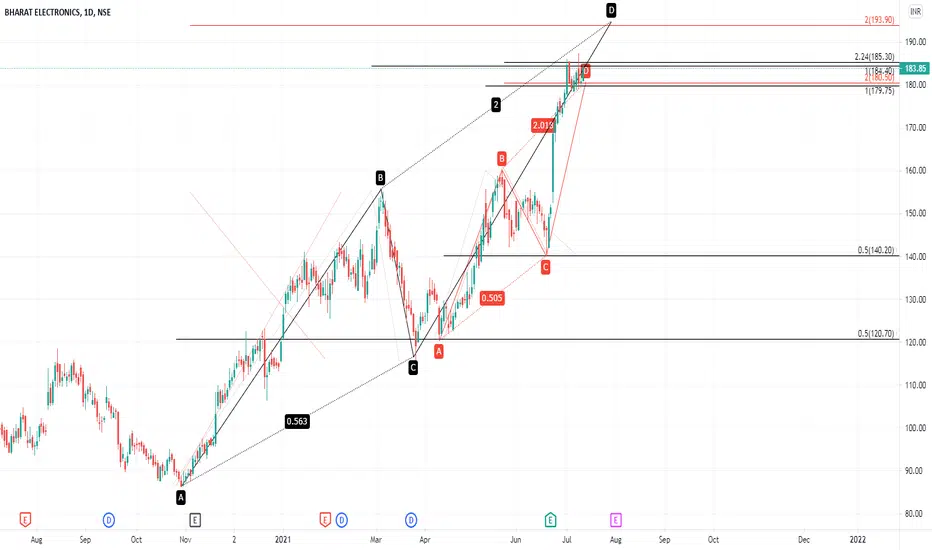
BEL Making Bearish Twin AB=CD on daily chart BEL potential reversal zone 190-92 CMP 184 can correct till 165 View Negated above 195 daily closeShortby JP-PROHARMONICSUpdated 21
TWO BEARISH PATTERN IN SILVER MICRO IN BULLISH TRENDRisky Bearish pattern in Silver Micro If BEARISH ABCD SELL ACTIVATED AT EXACTLY 70107 AT EXACTLY VERTICLE RED LINE, IT IS VALID SELL CAN ADD MORE AT RED HORIZONTAL LINE MENTIONED ABOVE ABCD SELL AND SL MARKED IN BLACK TARGETS MENTIONED IN BLUE LINE ************************************************* If BEARISH CYPER activated at 69342 at anytime I will take entry with SL MARKED IN BLACK FOR TARGETS mentioned after BLUE HORIZONTAL LINEShortby Elango-ragavanUpdated 2
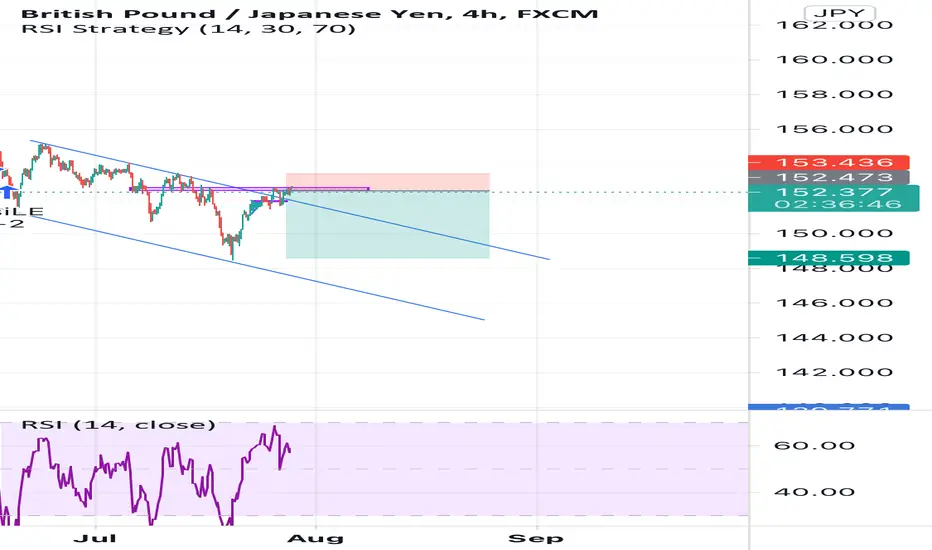
GBPJPY 1 hour shortCorrect time to Sell Gbpjpy. Good impulse move now lets make this corrective. ;) Entry 152.50 Sl 153.40 Tp 148Shortby Akhilrajfx0
Bullish Bat on auropharma 1 hr chartAuropharma potential reversal zone 960-65 can test 1000 view negated below 945 daily close Thanks Jigar PateelLongby JP-PROHARMONICS0
BULLISH ABCD (EXTENDED) PATTERN IN CRUDEOILCaution note: It seems "Trend" trying to change sell from buy side. If it is valid pattern you can get first two targets if SL safe. Anyway act as per your own analysis. Good luck!!Longby Elango-ragavanUpdated 3
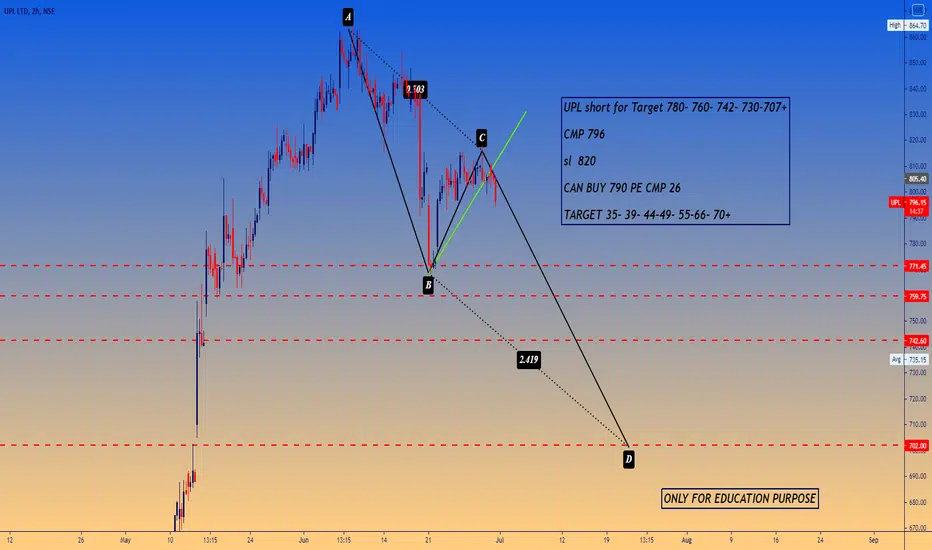
UPL short for Target 780- 760- 742- 730-707+ CMP 796 sl 820 UPL short for Target 780- 760- 742- 730-707+ CMP 796 sl 820 CAN BUY 790 PE CMP 26 TARGET 35- 39- 44-49- 55-66- 70+Shortby Bilal_KaziUpdated 0
IRFC Bullish long termCurrently IRFC in No trading zone. It will breakout on either side very soon. If bearish then will go on forming AB=CD diamond pattern. If Bullish then will go near 30 in coming months. watchout for breakout. The targets marked on chartby Sandeepk31Updated 26

 Short
 Long

 Long
 LongLong
 LongEducation
 LongLong
 Long
 Long
 Short
 Long
 Short
 Short

 Short
 Long
 Long
 Short