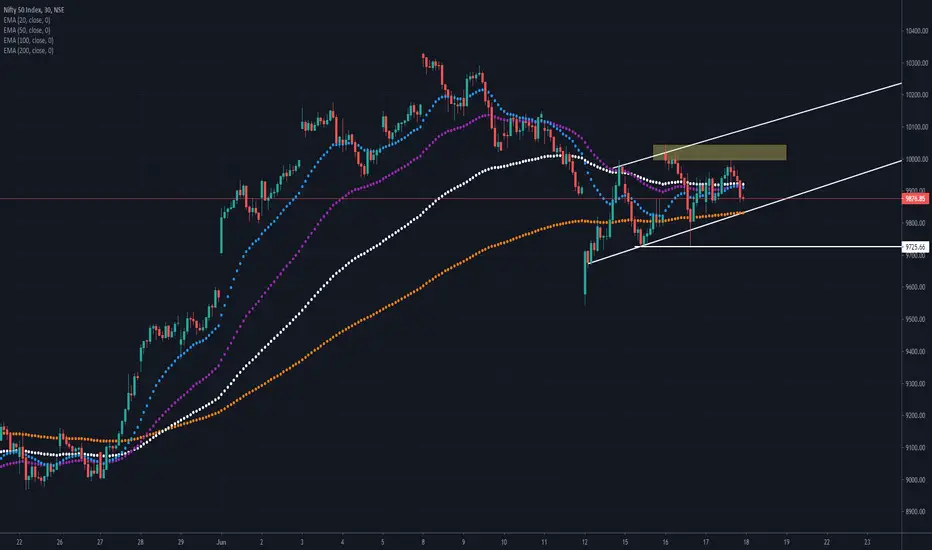
NIFTY BULLISH CHANNEL TO BE TESTED TODAYNIFTY INDEX TREND SETUP
-there is a bullish channel on a 30-min chart on nifty index
-which might be breached in the opening
-important thing is nifty is having support at 9720-9750
-that is the area from where we have seen strong bounce back
-it remains to be seen if nifty bounces back from this levels or not
-we have expiry today break i doubt that we might break below 9750 on closing basis
NIFTY TRADE SCENARIO
-avoid taking directional trade today as we have expiry
-market might again ra
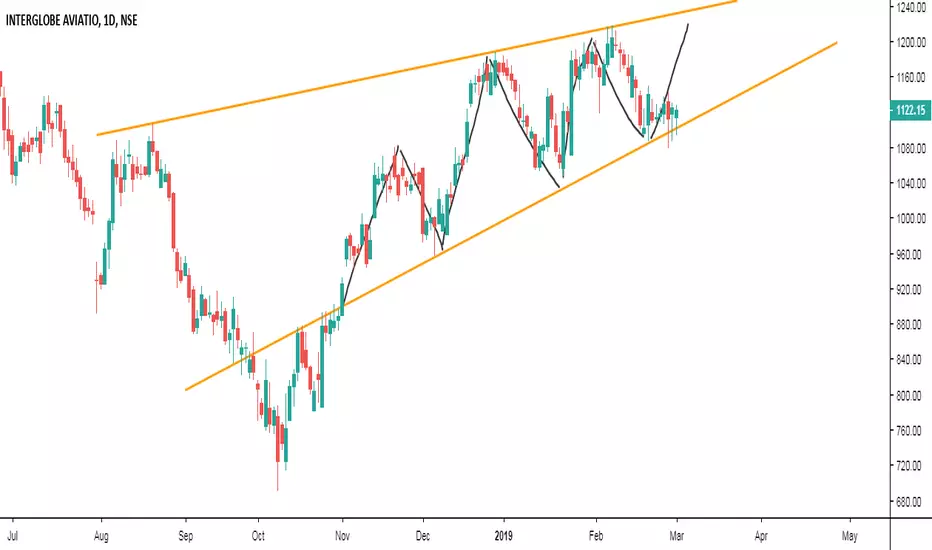
Ascending Channel
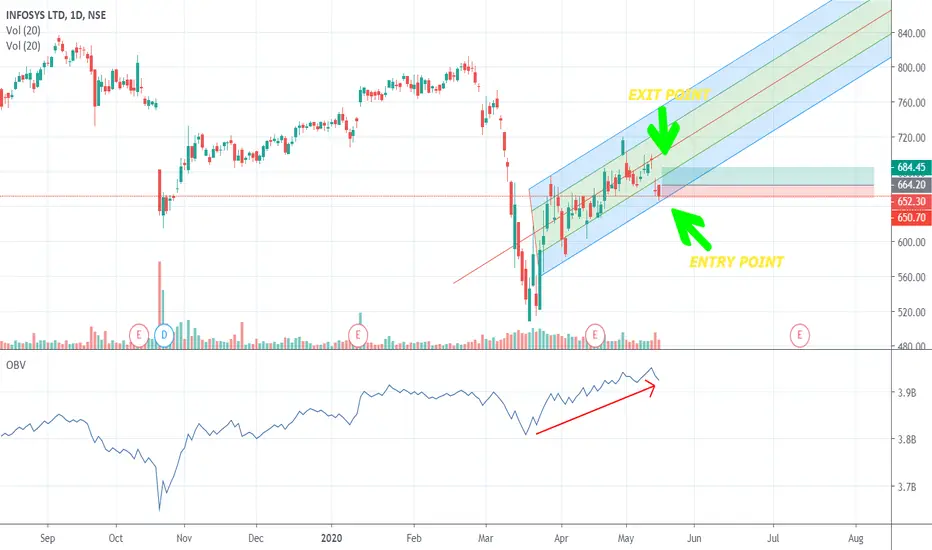
LONG POSITION ON INFOSYS[ b]This analysis is only for educational purposes, Invest at your own risk!
INFY closed at 652.30 on Friday with relatively low volume near its Support line
An uptrend can be seen in the ON BALANCE VOLUME INDICATOR
Using the pitchfork an uptrend can be spotted in the price too
A long position can prove to be profitable by buying in at 652-653 Range and targeting around 670-685 range
The percentage profit should be based upon the risk taking capabilities of an Individual
ALL TH
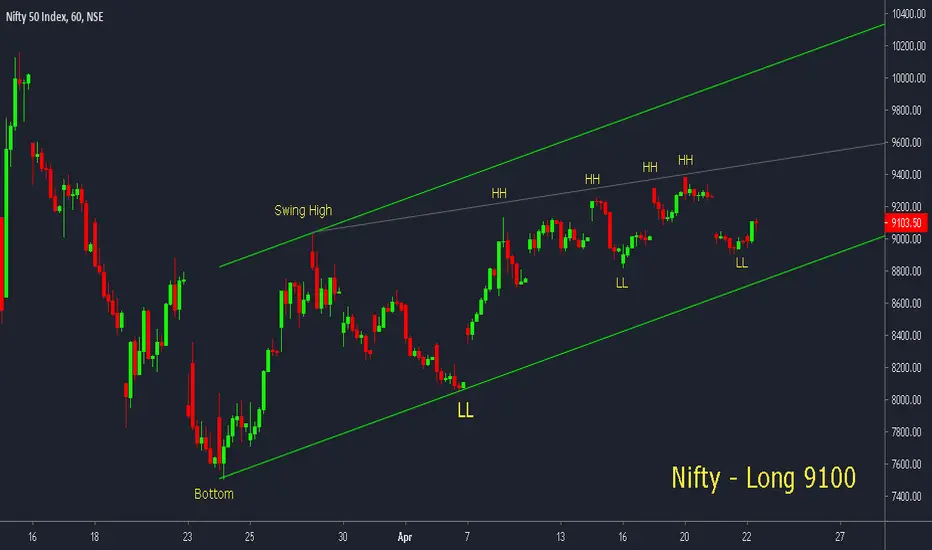
Nifty - Opening Long in Counter Trend. Nifty Long at 9100 | Stop-loss 9000 | Target 9600
Risk Reward 1:5
Nifty moving up slowly and on the daily chart, it's making series higher highs and lower lows.
The Primary and Intermediate trend is still down.
Trading this counter-trend rally with very tight stop-loss.
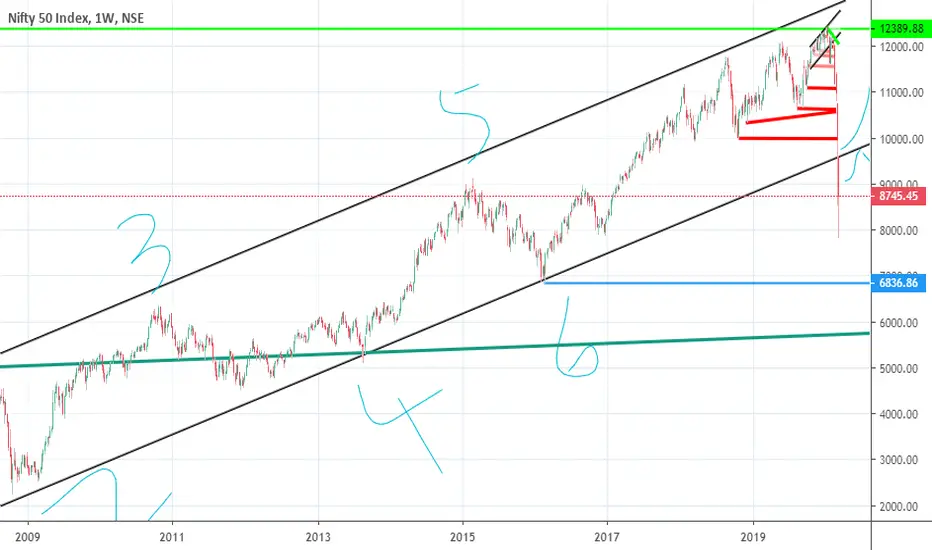
NIFTY'S NEXT MOVES Hi dear friends, I am posting my own view on nifty/s next moves. Nifty formed a bearish wolfie wave chart pattern in the monthly chart. So It is expected that nifty may touch 7000 levels in the coming days. As wolfie wave is a powerful chart pattern and its reliability is more. So please watch the moves of nifty.
This is only for educational and learning purpose only. I am not giving any recommendation. Please do your own analysis in buying or selling. Please watch only the m
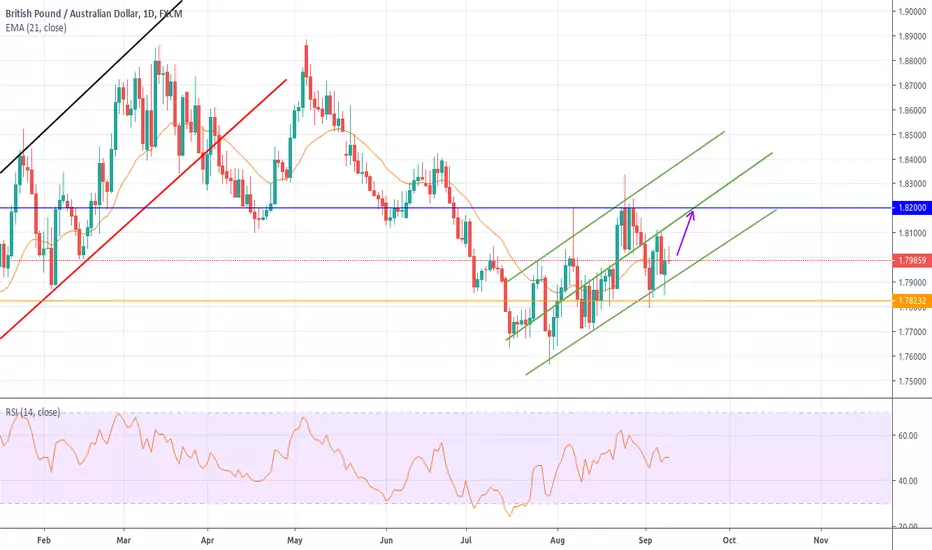
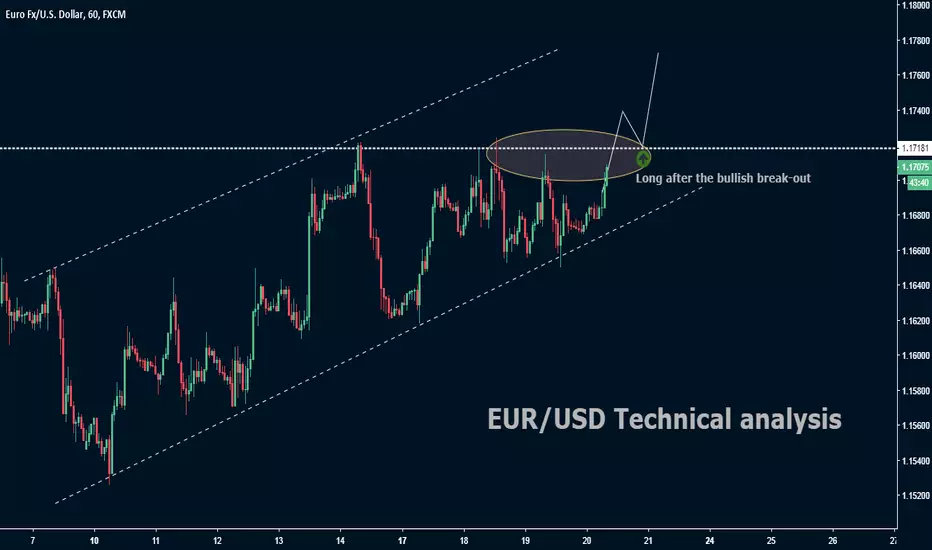
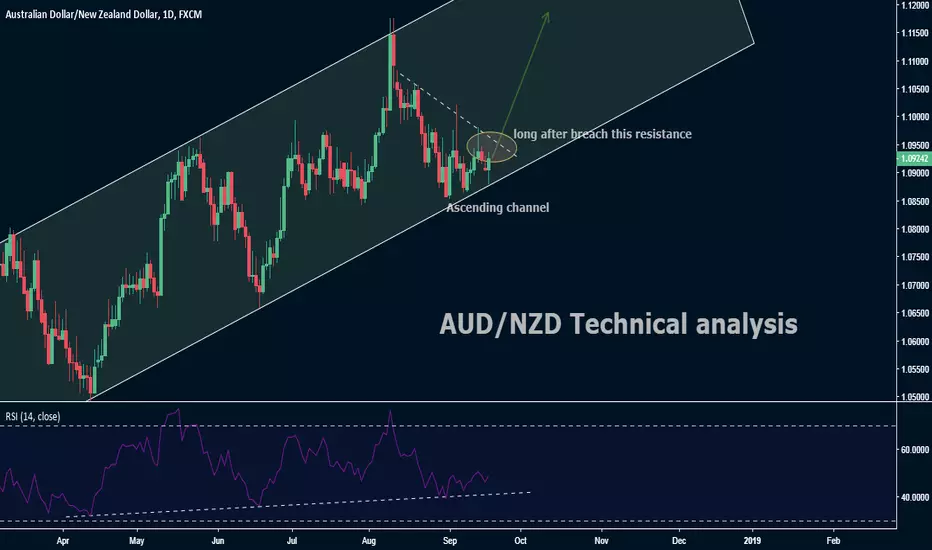
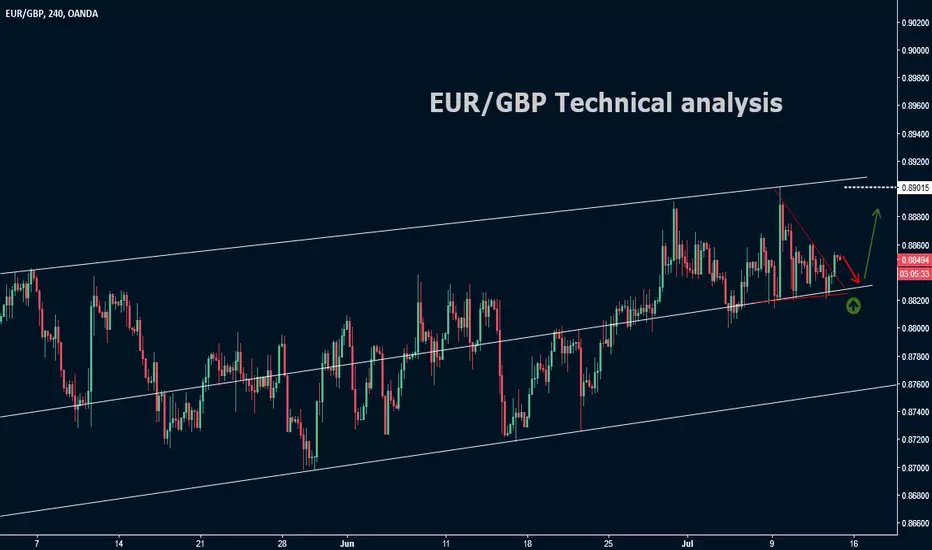
Buy GBPAUD : At the bottom of the channelGBPAUD has formed a rising channel pattern on a daily basis with the current prices trading at the bottom of the channel, creating a buying opportunity. The expected target for the trade is at 1.8200 which is the mean of the channel and the SL for the trade is at 1.78232.
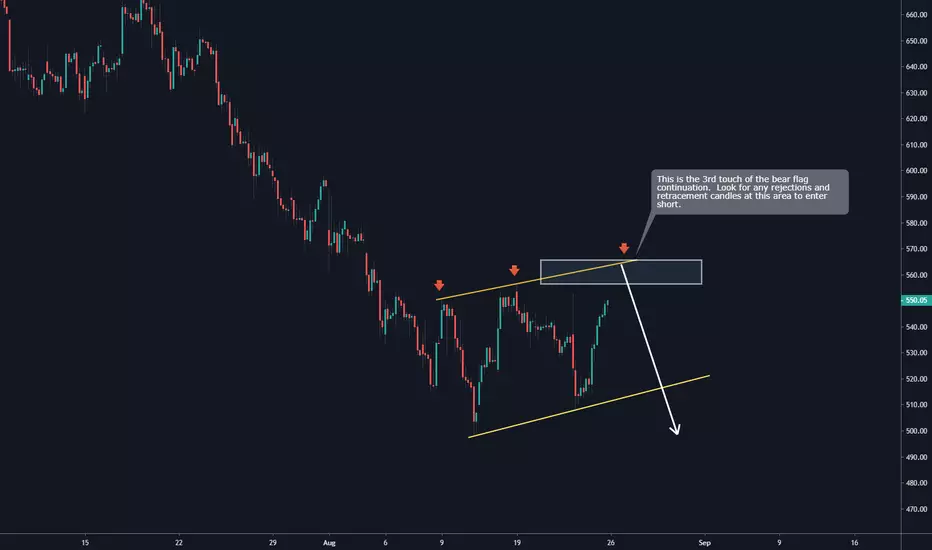
UPL - 60Min - More 10% downside ?UPL is in a deeper bear flag continuation pattern. The stock is approaching a key zone between 556 - 565. This will be the 3rd touch of the bear flag indicating pattern completion. If there are strong rejections at this area the stock can reserve and continue its move to the downside potentially till the 500 levels.
Sell Zone - 556 - 565
Traders should enter short only after the close of any rejection candle. ( pinbar, engulfing)
Stoploss - 570
Target 1 - 520
Target 2 - 500
Disclaimer
This
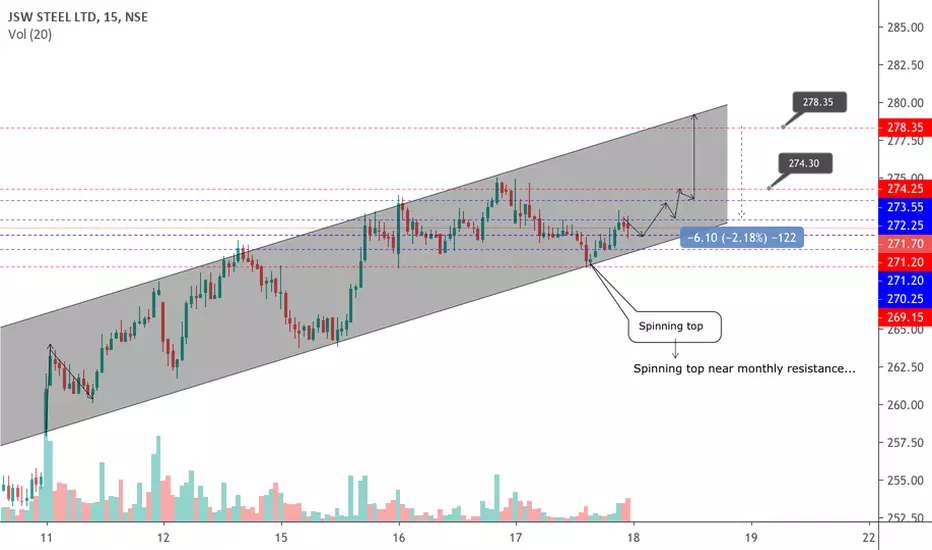
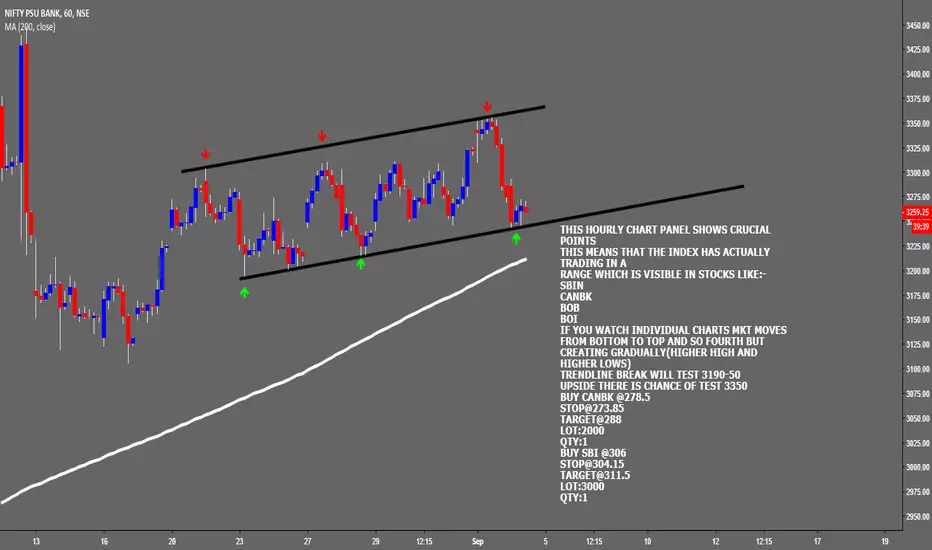
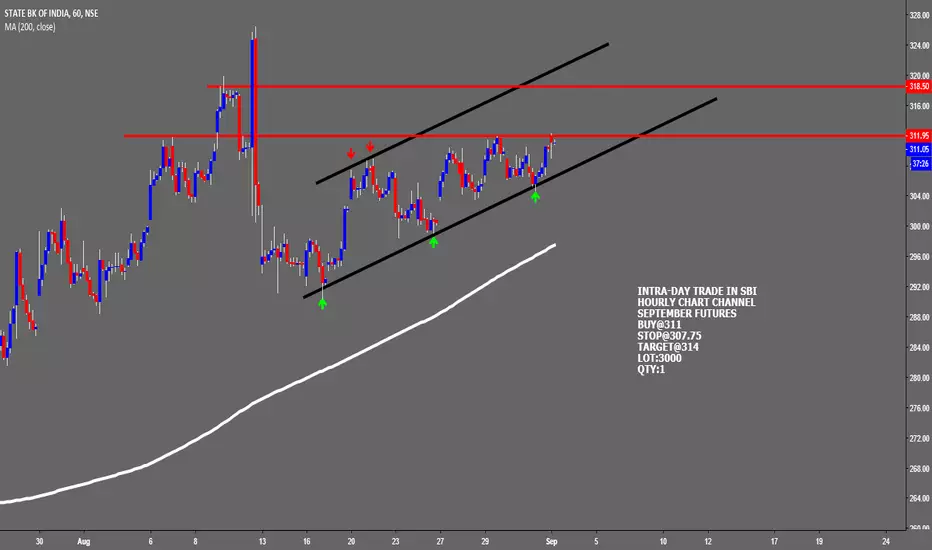
ASCENDING CHANNEL ON HOURLY CHART IN PSU BANK INDEXTHIS HOURLY CHART PANEL SHOWS CRUCIAL POINTS
THIS MEANS THAT THE INDEX HAS ACTUALLY TRADING IN A
RANGE WHICH IS VISIBLE IN STOCKS LIKE:-
SBIN,CANBK,BOB,BOI
IF YOU WATCH INDIVIDUAL CHARTS MKT MOVES FROM BOTTOM TO TOP AND SO FOURTH BUT CREATING GRADUALLY(HIGHER HIGH AND HIGHER LOWS)
TRENDLINE BREAK WILL TEST 3190-50
UPSIDE THERE IS CHANCE OF TEST 3350
BUY CANBK @278.5
STOP@273.85
TARGET@288
LOT:2000
QTY:1
BUY SBI @306
STOP@304.15
TARGET@311.5
LOT:3000
QTY:1