TOP/BOTTOM REVERSAL CANDLE PATTERNSHi
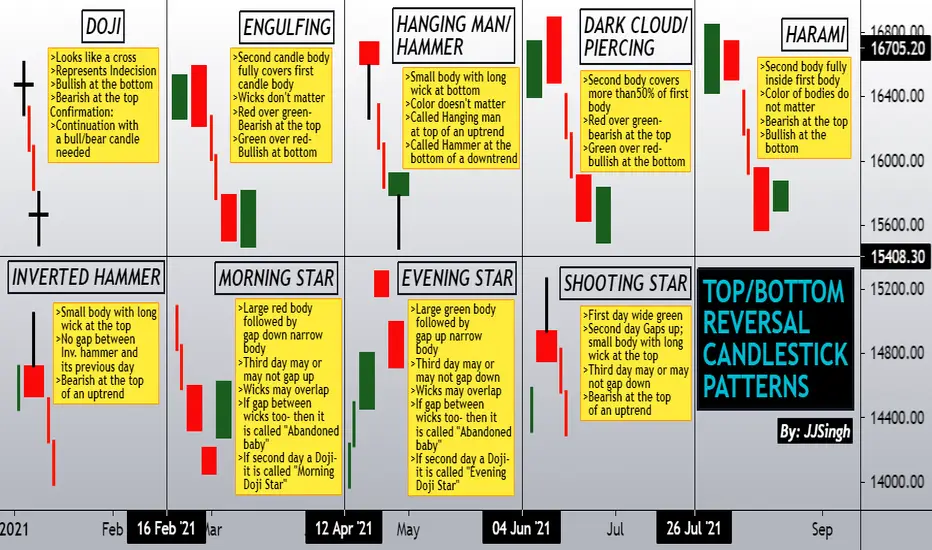
Its been a while since my last post. In this post I have represented selective candlestick reversal patterns.
In a candlestick, "body" represents the distance between candle OPEN and CLOSING price. Whereas "wicks" represent the entire range of the candle from TOP to the BOTTOM.
In most of these patterns only bodies are important. There are no conditions for wicks unless specifically mentioned like in abandoned baby star and (first two candles of) shooting star pattern. In an abandoned baby
Ascending Channel
WaveTalks-Nifty-The Evening Star / Wedge CollaborationThis short video explains how the evening star turns into a wedge pattern. If correct, downside 16590 was critical support, holding above Nifty could bounce back again to 16680-16700. On the upside, Holding below 16712 highs, It can attempt to fall back again to 16615-16625 & assuming that if Index falls below 16590-critical support, it can fall to 16500 / 16440 / 16400 levels
When you splash around the water, you get to hear a peculiar sound which you heard over the video at the start.
I hav
Mentorship InstaView 26 Aug’21: Rare Boring Expiry
Nifty View: Hi good evening traders … we are on the evening of 26th of August 2021, fairly muted session for the nifty specially keeping in mind that we had the expiry of derivatives contracts today, up by just six points on the daily timeframe. We now have consecutive to spinning tops and on a day on day basis you can see lower high and lower lows, this is not exactly a bearish sign but this is a sign that we should take it with a little caution. There is a price momentum divergence on the dai
Mentorship InstaView 25 Aug’21: Spins off the New Life High Nifty View: With today's flattish move the benchmark Nifty has created somewhat like a “Spinning Top” on the daily time frame. This suggests uncertainty and incapability to hold onto the new life high. This failure was mainly due the underperformance that we noticed within the banking and auto stocks. We can also observe a price-momentum divergence on the daily time frame which can lead to some consolidation/ correction in days ahead. So it is advisable to maintain a bullish bias but with a bit
SRTR hammer pattern formation on support zoneIt is looking a good buying setup
Hammer formation ,Price successfully closed above the crucial support zone
stop loss is small compare to the target,
the stock is in a consolidation phase if this trade work out and stock picks up than a major resistance breakout can be enjoyed.
SLong
TCS - Ascending Channel Bullish Breakout TCS has broken out of the ascending channel, supported by high volumes.
It can be bought between the price range of 3400 - 3450, for a target of 3650, which it should hopefully achieve before the next earnings are published.
Stop loss can be maintained at 3349. Refer the Fibonacci Retracement given in the chart to identify the support levels, if you do not wish to keep the stop loss.
Please follow us for more trading setups like these.
If you have any queries/suggestions related to above patte
FMCG GIANT GAVE CHANNEL BREAKOUT !HidustanUnilever - The FMCG giant has given a good breakout from its major channel pattern . Stock was in tight upward channel range since approx past 2 years ( Sep 2019 ) and now it has finally given a good breakout from the channel.
Another critical point was that there was a Sub pattern also , which was Double Bottom which is also a bullish pattern.
We all have heard about some of the famous brands like Dove, Lux, Lifebuoy, Pears, Hamam, Lyril, Rexona, Surf Excel, Wheel, Comfort, Clinic Pl
NIFTY trend analysischarts gives the indication before the bigger trend starts...
nifty started its upward journey by making low 16163 with doji on 11th aug 2021
after that given number of confirmation to add longs... and went on to make high 16702
now again nifty made doji at top and doji low 16672 broken down with confirmation candle
given 1st hint of correction than back to back other two confirmation also given
now trendline broken .. expect minimum target of 16400
than important level 16340 .. if this level
HONAUT- Tweezer Bottom at Strong Support LevelsFollowing Chart is of Honeywell Automation which Clearly shows Tweezer Bottom at the Support Level of @39130
The trend must get reversed with Targets anywhere around @48000 to @50000 if the Strong Resistance Level is Broken @45000
The RSI is just reversing from the Oversold Region which hints a nice time to buy.
All in all you will end up with a sweet 11% profit in short term even if you book the profits @45000
Risk averse traders might wait for another day to confirm.
Do follow for more tra
Mentorship InstaView 16 Aug’21: Shooting Star ... Make a Wish
Nifty View: It has been a one-way high momentum rally for the benchmark Nifty over the past few trading sessions. At today’s close at 16,559, the index posts yet another positive day - up 42 points or 0.25%. A look at the 75mins chart, and we can see a “Shooting Star” which under the Japanese Candlestick parlance is a sign of a possible reversal. Now there is no doubt that it is a beautiful shootings star and you can wish for a correction, which is fine and healthy for the underlying uptrend. B
Shriram Transport-Hammer in SupportHammer pattern formed and reversal happened in support.
Note:Purely for Eductional purpose
SLong
Mindtree ready for explosive moveWait for range break.
Expect 3 to 4 % intraday move after the range break.
6 inside bars with dry volumes. Narrow range movement.
Good intraday possible.
M
#HDFC bullish harmonic updated Reversal worked perfectly from 2384.
Long term target 3000/3200+
SL -2380
CMP:2623 @9 Aug 2021
Timeframe - 6-12 months
HLong
Banknifty - Morning Star Pattern 10 AugWhat Does Morning Star Mean?
A morning star is a visual pattern consisting of three candlesticks that is interpreted as a bullish sign by technical analysts.
A morning star forms following a downward trend and it indicates the start of an upward climb.
It is a sign of a reversal in the previous price trend. Traders watch for the formation of a morning star and then seek confirmation that a reversal is indeed occurring using additional indicators.
The opposite pattern to a morning star is th
Weekly BTC-USD)(9th August)BTC continues its joyride for the third straight week, it has appreciated by ~50% in the last 3 weeks. With this week’s bullish candle, BTC has completed 3 White Soldiers candlestick patterns, this is a bullish pattern and is used to predict market reversal. Currently, it is sustaining above its 0.618 Fibonacci retracement level, which is present at $43,045.
After almost 2 months of consolidation, BTC managed to decisively break its sideways trend by closing this week above $41,500. Weekly MAC
Bullish Engulfing & Cup & HandleIn Nifty Metal, today Bullish Engulfing have been formed.
And also gave breakout from the handle of the cup.
The pattern is small tough. Let's see how it goes.
We may see breakout from the resistance line soon.
Let's see.
This post is for information purpose only.
Just sharing my own analysis.