
Ascending Triangle

 Long
Long
TATA POWER TRADE IDEA | 8/4/21All the reasons for the trade have been explained in the video.
---HAPPY TRADING
 Long
Long
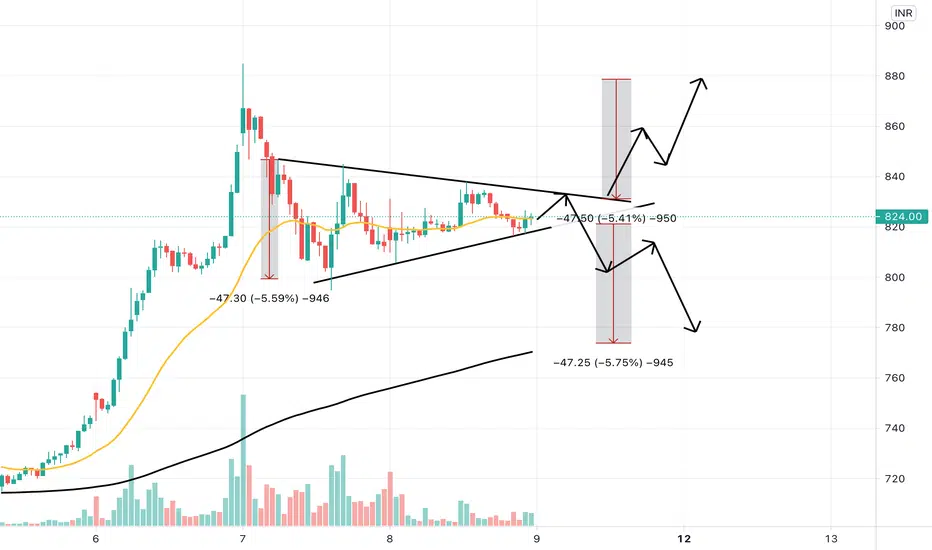
ADANI PORTS ON 15 MINS CHARTAdani port has made Triangle price action pattern. It can also be called Ascending triangle. As we have discussed earlier a lot of times that Ascending triangle is a neutral pattern n it can give breakouts or breakdown ie can move either side up or down. Traders are told to hold target of the exact price range of triangle patterns high n low. Trade safe. Look for long setup when pattern is broken with good volume & vice averse for short trade too.

 Long
Long
FILATEX Ascending Triangle BreakoutNSE:FILATEX Levels are Mentioned in the chart... Look for Swing
Note:
1. Views are personal. Recheck and take the trade as per your RR.
2. Always remember SL is your lifeline not the big target...
3.Follow us for more patterns and like, share so that we feel it is helpful to many and share more patterns...
3. Views given here is not a tip rather it is for educational purpose... After market opens, the condition might change so learn to handle for different conditions..
4. To learn more about patterns, Psychology behind the trade and price action trading... contact us.. Thanks..
 Long
Long
Nifty - Ascending Triangle Pattern
Buy Level = Above 14890 (Target 1 - 15000, Target 2 - 15330)
Sell Level = Below 14750 ( Target 1 - 14600, Target 2 - 14500)
Please comment and let me know if you have any other ideas or observations or queries. Please feel free to reach out to me on Trading View.


Nifty InstaView 07 Apr’21: Verge of a BreakoutNifty View: It was a good day for the benchmark Nifty index as it extended its rally further. A look at the 75-minute chart suggests that prices are on the verge of a break out from an ascending triangle. The underlying short-term trend is still very much up and a break above this triangular pattern will set in fresh buying impetus for the index and the overall market. However, we should not forget that in the last two months the short-term trend has been fairly volatile and so we will continue to trade cautiously on either side of the market and stick to short-lived trades only. In terms of levels, a sustained close above (14,900–15,000) level for the index will set in positive sentiment for the overall market.
Thank you for following my work and please feel free to share your thoughts and suggestions.
Trade Well. Trade Wise.

Nifty InstaView 06 Apr’21: Unpleasantly VolatileNifty View: Intraday volatility continues as the benchmark Nifty index consolidated yesterday’s sharp sell-off today. The nascent underlying short term UP trend is now vulnerable for a reversal. On the 75min chart we can clearly observe a range bound activity for the Nifty which is taking the shape of an Ascending Triangle. A break below today’s low of 14,616 will trigger fresh weakness for the index. On the upside, the index needs to break and sustain above 14,900 for some positive sentiment and momentum. Till then, stay directionally unbiased and keep your trades as short lived as possible.
Thank you for following my work and please feel free to share your thoughts and suggestions.
Trade Well. Trade Wise.

POWERMECH Ascending Triangle BONSE:POWERMECH Levels already mentioned.. Good for Swing...
Appreciate our work by like, share and following..
Note:
1. Views are personal. Recheck and take the trade as per your RR.
2. Always remember SL is your lifeline not the big target...
3.Follow us for more patterns and like, share so that we feel it is helpful to many and share more patterns...
3. Views given here is not a tip rather it is for educational purpose... After market opens, the condition might change so learn to handle for different conditions..
4. To learn more about patterns, Psychology behind the trade and price action trading... contact us.. Thanks.
 Long
Long
TEAMLEASE Ascending triangle BreakoutNSE:TEAMLEASE Levels already mentioned.. Good for intraday to Swing...
Appreciate our work by like, share and following..
Note:
1. Views are personal. Recheck and take the trade as per your RR.
2. Always remember SL is your lifeline not the big target...
3.Follow us for more patterns and like, share so that we feel it is helpful to many and share more patterns...
3. Views given here is not a tip rather it is for educational purpose... After market opens, the condition might change so learn to handle for different conditions..
4. To learn more about patterns, Psychology behind the trade and price action trading... contact us.. Thanks.
 Long
Long
Hindustan Unilever BreakOut or PullbackHindustan Unilever #HUL
Expecting some pullback(ideal entry around 2216 in this case)
If 2456 resistance breaks then wait for a retest of support
 Long
Long
INFY TRADE IDEA | 5/3/21All the reasons for the trade have been mentioned in the image.
----Happy Trading
 Long
Long
 Long
Long
Godrej Industries Ascending Triangle on Daily TFGodrej Industries on a daily timeframe is forming ascending triangle. And LTP(Last Traded Price) is at a very crucial resistance zone on daily chart.
Expecting a pullback around 487(around -10% from current market price). It'd be a good buy at around 487 for swing as 487 is a price at trendline support as well as horizontal support.
So Godrej Industries is at wait and watch levels for now!


HUL - Wedge formation in ascending triangle I have plotted the HUL wedge formation with ABC wave structure in ascending triangle. The price is likely to retrace up to 2250 to 2230 in 3-4 weeks then again it will bounce back to previous high 2560 in further few weeks, total Duration of pattern will be 7-8 weeks. Observation: 1. Wedge formation in ascending triangle 2. Price is respecting 50 sma on weekly time frame 3. Cup and handle pattern completion on daily time frame 4. Wave A and C are of equal length 5. Divergence in RSI and %R.

 Short
Short
Study 3: Ascending Triangle - ASIAN PAINTSThis is Just for study purpose. ASIAN PAINTS seems to be a ascending triangle breakout (Pattern - strong, Confident - average).
Buy if first candle opens above 2471 (SUPPORT) Mar 29 Monday.
It may retest at SUPPORT and possibly could reach 1st level target 2563 (RESISTANCE) and if this breaks it may reach 2nd level target 2665 (LONG POTENTIAL).
 Long
Long
ASCENDING TRIANGLE BREAKOUT Today I've taken a long position in ACC as it has given an ascending triangle breakout with 20 day and 50 day moving average golden crossover.
My entry was at 1873.90
Stop loss at 1751.20.
Target : 2119.45
Stock is trading at all time high that is why I have kept 1:2 risk reward only.
How many of you have also taken entry in this stock? Please do let me know. And also feel free to share any opinions.
Note : This is not a tip or any kind of suggestion. Please enter at your own risk and take the responsibility if you do.
 Long
Long
UNI-USDT(Ascending Triangle Breakoout)1. With TVL in the DEX protocols standing at $16 Bn, Uniswap stands in the third position with $4 Bn locked in its protocol.
2. UNI has been trading above its 20 and 50 DEMA. It is not able to sustain above $35. Closing above $35 on Daily Time Frame may trigger fresh buying to the upside to the levels of $39 followed by $45 .
3. The support to the lower side is present at $32.5 .
 Long
Long
Inverted Hammer inside channel pattern | KOTAK BANKInverted Hammer is a reversal candle formed at the bottom of the ascending triangle pattern in Kotak Bank's chart . Looks good for upside move .


Bombay Dyeing | Ascending triangle pattern breakoutViews are personal and for educational purpose only.
Watch my other analysis also.
 Long
Long
CYIENT 1D ASCENDING TRIANGLENice bounce from the intermediate trend line three times with good above avg volume and then retracement with low decreasing volume. Breakout with nice volume. Overhead resistance is present indicating proper exit points to be careful about. Triangle is not perfect yet the formation is interesting. NSE:CYIENT
 Long
Long