GREAT PRODUCT, DEAD TOKEN | Project Review 37: $BAT 🌚➡️📉 GREAT PRODUCT, DEAD TOKEN | Project Review 37: BITMEX:BAT
Do you know?
BITMEX:BAT (Basic Attention Token) powers the Brave browser, A REAL product with 107 MILLION monthly users, built by the inventor of JavaScript. The product is thriving. The token? Down ~97% from ATH. This is the trap that fools SMART investors. 😳
The Raise:
▶️ ICO (May 31, 2017): Raised ~$35M in UNDER 30 SECONDS, one of the fastest ICOs in history
▶️ Built by Brendan Eich, inventor of JavaScript, co-founder of Mo
Bat
EURGBP trade Idea, sell on rise!📊 TRADE SETUP
Instrument: EURGBP
Direction: SELL
Entry: 0.85239
Stop Loss: 0.85439
Take Profit: 0.85039
Risk: 20 Pips
Reward: 20 Pips
Risk:Reward = 1:1
Nano Lot → 0.001 Lot → 100 Units → +£0.20 (20 Pip Target) → -£0.20 (20 Pip SL)
Micro Lot → 0.01 Lot → 1,000 Units → +£2.00 (20 Pip Target) → -£2.00 (20 Pip SL)
Mini Lot → 0.10 Lot → 10,000 Units → +£20.00 (20 Pip Target) → -£20.00 (20 Pip SL)
Standard Lot → 1.00 Lot → 100,000 Units → +£200.00 (20 Pip Target) → -£200.00 (20 Pip SL)
For Educat
Xauusd gold Monthly updates 1.6.26...30.6.26*🟡 XAUUSD( GOLD) – MONTHLY UPDATE 🟡 ⏰*
*Validity: 1-06-26 to 30-06-26*
*🔹 Bullish Scenario (BUY)*
*• Trend Confirmation: Above 4780*
*• Targets: 4960 – 5160*
*🔻 Bearish Scenario (SELL)*
*• Trend Confirmation: Below 4340*
*• Targets: 4160 – 3940*
*🔄 Key Reversal / Entry Level: 4557*
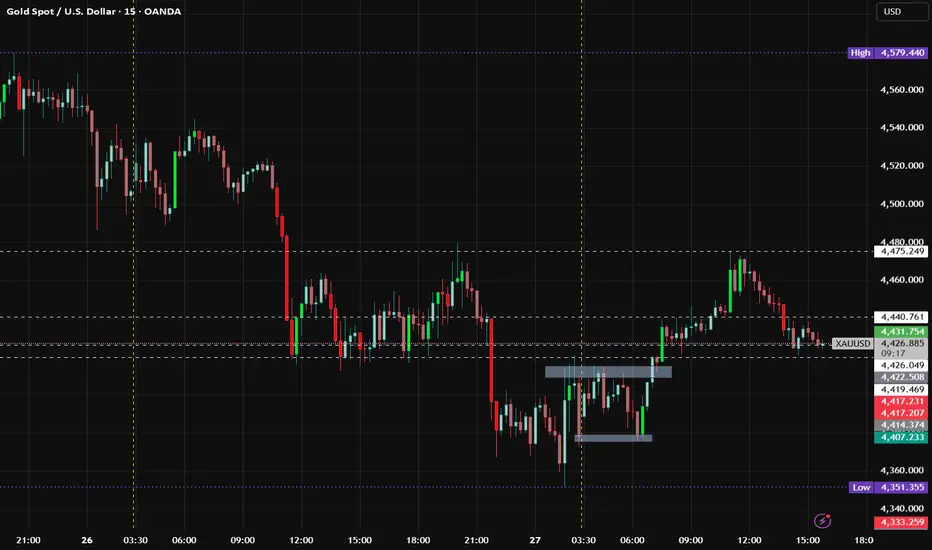
XAU/USD (Gold) – Bullish vs Bearish Scenario (Intraday)Gold is trading near $4428 with mixed momentum, but overall structure still leans bearish unless key resistance breaks.
Bullish Scenario
If price breaks & sustains above 4441
Upside targets: 4458 → 4472 → 4490
Momentum buying can trigger short covering rally
👉 Bias turns bullish only above 4450+ hold
Bearish Scenario (Primary)
If price rejects near 4435–4445
Downside targets: 4407 → 4389 → 4355
Indicators & MAs still favor selling pressure
👉 Bias remains bearish below 4441
Intraday Pla
XAUUSD Outlook : Bull vs Bear | 23rd March'2026Gold (XAU/USD) is currently under strong bearish pressure, trading around $4243, marking a sharp decline of over -5.5%. The market structure clearly shows aggressive selling with all major timeframes (Hourly, Daily, Weekly) aligned on the sell side. Moving averages (MA5–MA200) are fully bearish, confirming a strong downtrend.
Technical indicators also support the downside — MACD, ADX, ROC, and Momentum indicators are signaling continued selling pressure. However, oscillators like RSI (11) and C
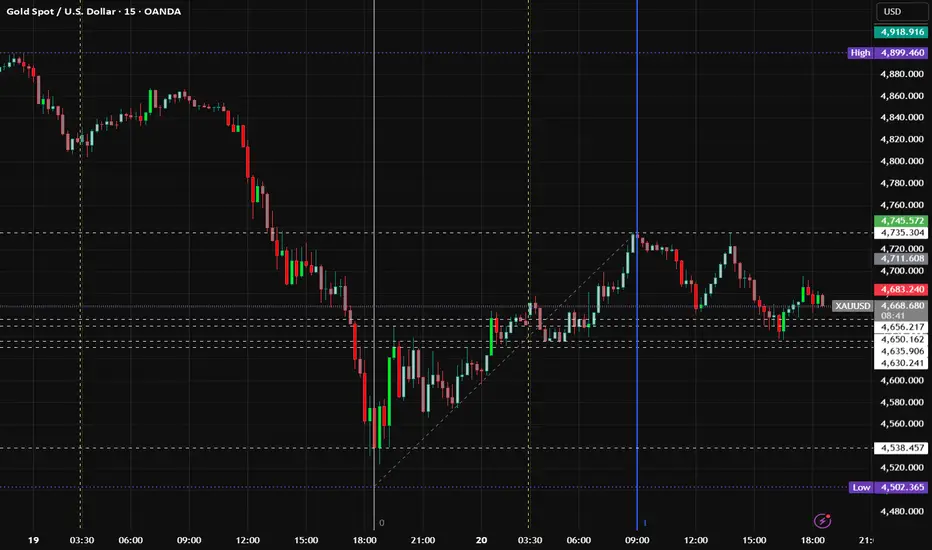
XAU/USD (Gold) | MARKET OUTLOOK | 20th Macrh'2026Gold is trading near 4679 with a minor bounce, but overall trend remains bearish as higher timeframes and indicators show strong selling pressure. The current move looks like a short-term pullback, not a reversal.
Key Levels
* Resistance: 4680 – 4725
* Support: 4628 – 4584
📉 Bearish View
* Below 4680–4700, expect downside continuation → 4628 → 4584
📈 Bullish View
* Above 4725, short-term bounce possible → 4778
Strategy
* Prefer Sell on Rise
* Buy only on confirmed breakout above 4725
Conclu
BTCUSDT Technical Analysis (1H Timeframe)BTCUSDT is showing a bearish structure on the 1H timeframe, with price rejecting strongly from the 71,300–71,800 supply zone and forming lower highs. The recent upside move looks corrective, and price is failing to hold above previous demand, signaling weak bullish momentum.
The key area to watch is 68,888. A breakdown below this level confirms continuation to the downside, with liquidity resting below recent lows. The next major demand zone sits between 68,000 and 67,200, aligning with prior r
GBP/USD – Short Setup Trade Narrative
Price created a lower-high structure after the earlier push up, followed by a sharp sell-off that broke intraday momentum.
A small liquidity grab beneath the prior low caused a corrective pullback into a premium zone, aligning perfectly with the bearish bias.
The current candle shows rejection inside the supply block / retracement zone, giving a clean short entry.
Confluence
Structural lower-high formation
Liquidity sweep before entry
FVG fill during retracement
Higher-tim
ETHUSD · 15M · SMC NarrativePrice has rallied cleanly into a premium HTF supply zone, tapping into a pool of resting buy-side liquidity above prior highs.
HTF Context
Previous range high clearly defined and respected.
Liquidity engineered above equal highs.
Current price trading in premium, far from value.
LTF Structure
Strong impulsive move up, low-quality pullbacks.
Final leg shows momentum expansion, typical of a liquidity run.
High probability this move is exit liquidity, not continuation.
Expectation
Brief p
XAUUSD (Gold Spot) Technical Outlook - 17/12/2025XAU/USD – Technical Update
Gold trades near $4,332 and remains in a strong bullish trend across all timeframes, supported by price holding well above key moving averages. Momentum is strong, though short-term indicators are overbought, hinting at minor pullbacks.
Key Levels:
Support: 4300–4305 | 4290 | 4270
Resistance: 4335 | 4367 | 4400
Intraday Strategy:
Buy dips: 4300–4310
Targets: 4335 → 4365
SL: Below 4270
Fundamentals:
US macro data & Fed expectations keep gold supported amid cautious
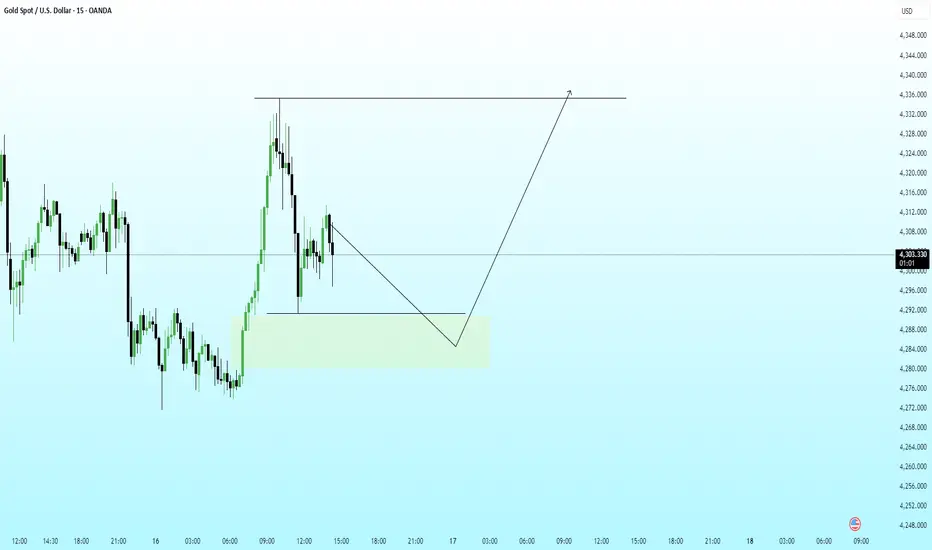
XAUUSD – 15M | SMC-Based Trade PlanGold is currently in a corrective phase after a strong impulsive move to the upside. Price has delivered a clear displacement, followed by a pullback into a refined demand zone, highlighted on the chart. This area aligns with prior bullish order flow and acts as a discount zone within the higher-timeframe range.
The current sell-off appears corrective, not impulsive. Expectation is for price to mitigate demand, sweep weak lows if needed, and then resume the primary bullish structure.
Execution
Zydus lifescienceIn weekly time frame forming Half bat pattern NSE:ZYDUSLIFE
only educational purpose
information provided is for informational purposes only and should not be construed as investment advice or an offer to buy or sell securities. Investors are advised to carefully review all materials and consult with a financial advisor considering their own financial situation and risk tolerance before making investment decisions. The disclaimer also often includes statements about no guarantees or war
Retail Investors and Algorithm AdvantagesIntroduction
In the modern financial ecosystem, retail investors—the individual investors who buy and sell securities for their personal accounts—are increasingly sharing the stage with institutional investors powered by sophisticated algorithms. The rise of algorithmic trading, machine learning, and data-driven investment strategies has created a paradigm shift in markets worldwide. For retail investors, this duality represents both opportunities and challenges: they have access to tools that
Federal Bank As per BAT Harmonic Pattern in Daily Time Frame.
Disclaimer
Information provided is for informational purposes only and should not be construed as investment advice or an offer to buy or sell securities. Investors are advised to carefully review all materials and consult with a financial advisor considering their own financial situation and risk tolerance before making investment decisions. The disclaimer also often includes statements about no guarantees or warranties regarding the
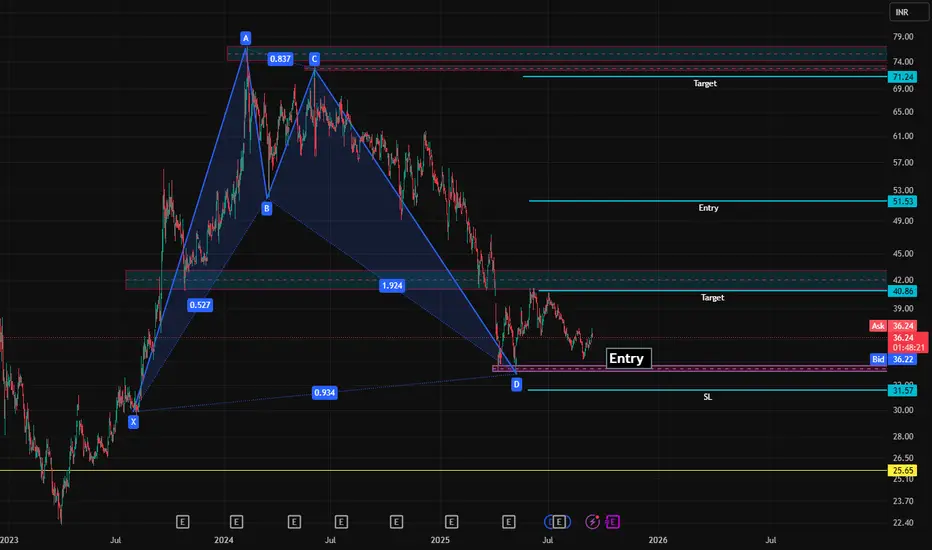
Central Bank Shows Bullish Bat PatternThe central bank has formed a harmonic Bat pattern and recently experienced a 50% decline, presenting a potential buying opportunity. The current support level is at 33, with a target price around 70.
From a fundamental perspective, the central bank continues to maintain stable monetary policies, aiming to control inflation while supporting economic growth. Its strong regulatory framework and commitment to financial stability enhance its prospects. Additionally, ongoing reforms and intervention
PUNJAB NATIONAL BANKHello & welcome to this analysis
In my previous post on the bank I had suggested the likelihood of it declining to 103 where it had double bullish harmonic patterns. (link to that post is given)
Now the bullish harmonic Bat & reciprocal ABCD patterns are indicating the probability of a rally till 106 & 109 as long as it sustains above 100.
Immediate resistance at 104 with strong support near 102.50
All the best
Linde India Ltd: Analyzing Investment Potential Amidst Recent DeTechnical Analysis: BAT Pattern and Support Levels
Linde India Ltd has formed a BAT pattern in its stock chart, experiencing a 40% decline from its recent highs. The stock is currently positioned with an entry point around ₹5930, while a significant support zone exists at approximately ₹5200, coinciding with a three-year long-term trendline.
Fundamental Performance Overview
Revenue Trends: Linde India reported a 12.16% decline in sales, marking its first revenue contraction in three years. This
Bharat Forge Ltd: Analyzing Investment Potential Technical Analysis: BAT Pattern and Support Levels
Bharat Forge Ltd has formed a BAT pattern in its stock chart and is currently trading with a 34% decline from its recent highs. The stock is finding significant support around the ₹1100 level, which may present a strategic entry point for long-term investors.
Fundamental Performance Overview
Revenue Trends: For the fiscal year 2023-2024, Bharat Forge reported a 10.54% decline in revenue, reflecting challenges in the automotive and industrial se
GOLDHello & welcome to this analysis
In 4hrs time frame GOLD (MCX) has activated a bearish Harmonic Bat pattern.
It could retrace down to 99500 - 98500, will consider 100750 as stop loss for this set up.
Do keep in mind, GOLD overall is very strong and this could likely be a shallow retracement.
Regards
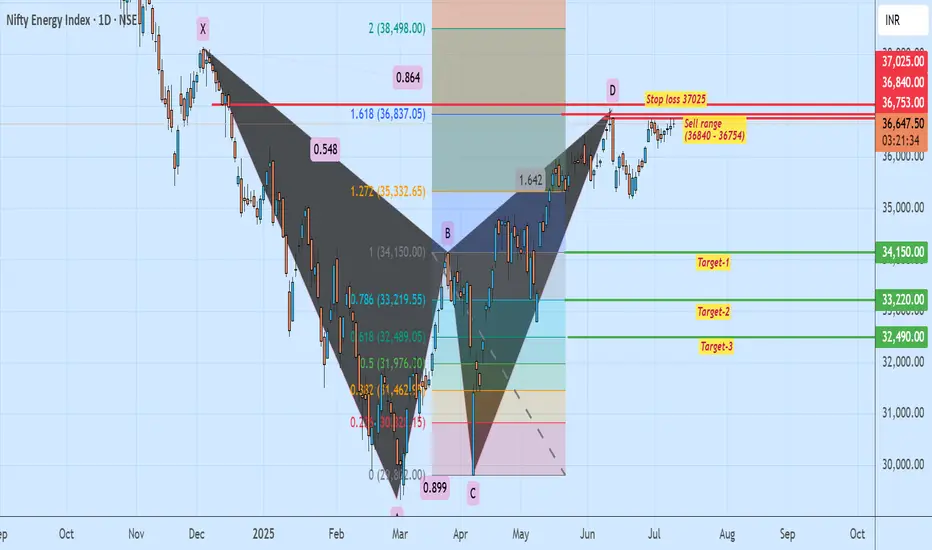
Nifty Energy Index - Bearish BatNifty Energy Index - Bearish Bat formed Bearish Bat Harmonic Pattern. Sell range, Stop loss and target details are mentioned.
Note: This chart is only for educational purpose. Not suggesting any trade. Please do your own financial assessment before taking trade.
I am not a certified analyst.
MEDPLUS HEALTHHello & welcome to this analysis
From a bullish Harmonic Bat pattern to a bearish Harmonic Alt Bat & bearish Harmonic ABCD in the weekly time frame.
Stock has entered in to potential reversal zone (PRZ) 1010-1050 of a bearish reversal probability.
Also note the 52w high and recent surge in price has come with low volumes.
A daily close below 940 could further pull it down towards 850-775.
Pattern negates if price moves above 1075
All the best