Bat
Nifty Sep FUTSL day candle close only, Target Trigger Price
All detail for chat. good entry at mark price only. and must stoploss minimum risk and good profit. risk ratio 1:1 to manage modified SL. This is not call, Just my idea. Please understand your risk and take full responsibility of your actions
BAT: Double FVG and CHoCH Point to a Strong Upward Move! 🌟💎 Paradisers, #BATUSDT has shown a Fair Value Gap (FVG) twice after taking liquidity and displayed a Change of Character (CHoCH) towards the bullish market structure, increasing the likelihood of a bullish move.
💎 If the price shows a pullback and indicates bullish signs from the FVG and Bullish Order Block (OB), which is supported by the Fibonacci 0.5 and 0.618 levels, then we can expect a bullish move.
💎 In the case the price falls without any bullish signs in these key areas, we can anticip
NIFTY MONTHLY BAT PATTERN OR HALF M PATTERN (Condition apply)* The market (NIFTY50) is currently trading at 22436. However, it's important not to blindly follow the buy or call side under the yellow box, as it signifies a sideways zone. For the past two days, I've observed a sideways market with premiums not showing significant increases.
Here are the levels and analysis for the NIFTY Monthly Future Traders:
Once the 22400-440 Level breaks then the Market will go towards the 21900 Level again.
If it sustains 22000 then also no big issue.
Note: Selling s
Auropharma - Classic Alternate Bearish Bat at 1131 (Sell)Disclaimer:
Trading in financial markets involves substantial risks. Consult your financial advisor before making decisions. This commentary is not a solicitation to buy or sell.
Auropharma
Last - 1106 / 1:14 pm / 1st April 2024
After Classic 5 Waves & Stock Topped at 1177 - Last Idea Published on 1st Feb 2024
Stock Dropped to logical support of 958.50 - Minor Support from the tops of 1177 as identified last. It dropped to 958.50 lows in next few days.
Currently, Stock Doin
Kalamandir looks very attractive, High Risk - Reward SetupFundamentals : Decent, Consistent growth on Sales, Profits and EPS. High Reserves (recently doubled) vs Debt. DII stake increasing.
Technicals : Bearish, Risky, Very attractive RR. Trendline support. Below listing price!
R 1: 220 (Trend reverse level)
R 2: 250
R 3: 290
Support Zone : 150-160
Matic Trend and Potential reversal zoneIn monthly time frame, Matic formed Bat harmonic pattern. It can reach upto $2.6 which is a potential reverssal zone. Personally i am holding this coin with price target of $2.6 - $2.8 .
MLong
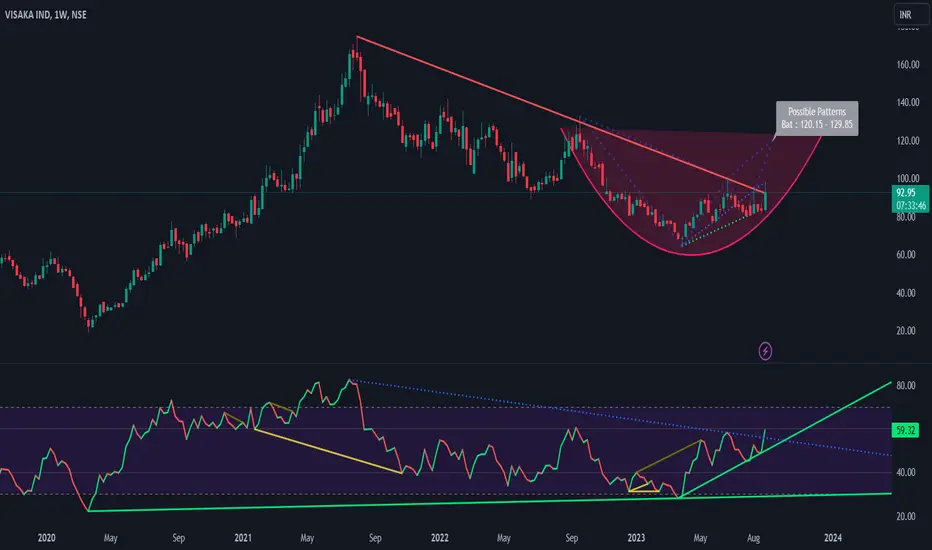
VISAKAIND - Trendline Breakout & BATIn this analysis, we will examine the technical aspects of the weekly chart for VISAKAIND, aiming to provide insights into potential trading opportunities based on key patterns and indicators.
Breakout of Weekly Falling Trendline:
The chart displays a significant breakout of a weekly falling trendline. Breakouts of trendlines on higher timeframes, like the weekly chart, often carry greater significance. This breakout suggests a potential shift from a bearish to a bullish trend. Such breakouts
MISHTANN Potential BAT Harmonic PatternIn this analysis, we will evaluate the technical aspects of MISHTANN's monthly chart to identify potential trading opportunities. We'll focus on key patterns and indicators to form a comprehensive view.
1. Breakout and Retest of Falling Trendline:
The most notable feature on the chart is the candlestick pattern showing a breakout and subsequent retest of a falling trendline. This pattern often indicates a potential reversal from a downtrend to an uptrend.
2. Potential BAT Harmonic Pattern:
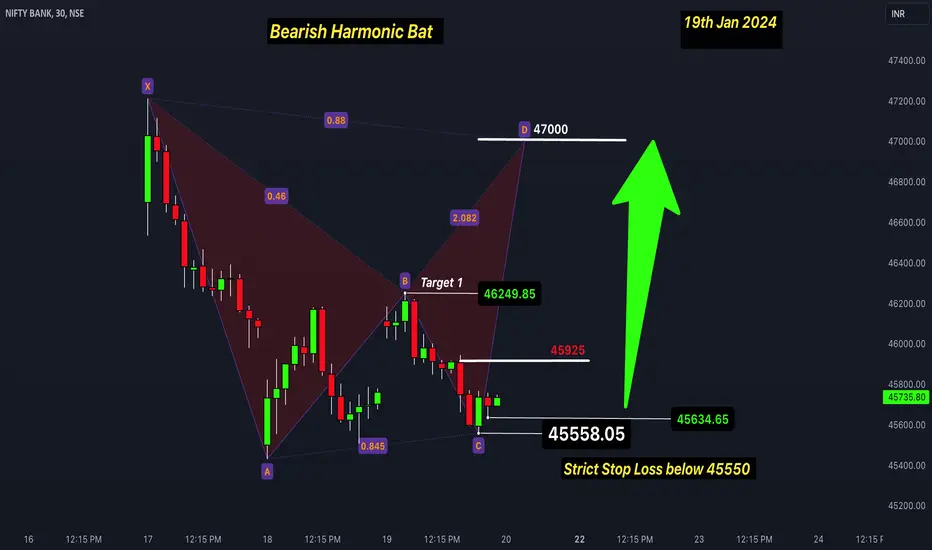
BankNifty - The Last Leg in Bearish Bat 45600 to 47000 Disclaimer:
Trading in financial markets involves substantial risks. Please consult your financial advisor before making any trading decisions. This message is not a solicitation to buy or sell. Perform your due diligence.
WaveTalks - Market Whispers: Can you hear them?
As discussed in the last idea today - 19th jan 2024 during last hour of trading. Index holded 45550-45600 zone rallied upside towards 45700+
We suggested to have patience & buy close to 45600
Strict Stops below 4
Bank Nifty Outlook- Harmonic, Historical & Impulsive 3rd Jan'24Disclaimer:
Trading in financial markets involves substantial risks. Please consult your financial advisor before making any trading decisions. This message is not a solicitation to buy or sell. Perform your due diligence.
WaveTalks - Market Whispers: Can You Hear Them?
Pattern Insight: Bullish Bat Harmonic Pattern
Measurements:
- X at 47411
- A at recent highs of 48636
- B retraced 44.5% of XA leg (from 47411 to 48636)
- C at 48450
Projected Zone for Point-D:
Expected Range
Gnfc chart studyGnfc spot around 755
weekly time frame
Bearish bat pattern formation
exact text book pattern formation.
counter might face resistance going ahead,
keep buffer of 2% on higher side,
if sustains above that levels than view get negated,
else as per harmonic pattern counter might retrace by 7-10%
Castrol Ind Big Volume Blast since last 8 yearsCastrol Ind looks very attractive..
Fundamentals : Very Strong, Consistent growth on Sales, Profits and EPS. High Reserves vs very low debt. Only slight negative point is FIIs holding decreased in recent quarter still overall parameters are healthy
Technicals : Very Bullish above 180 on weekly closing.. Harmonic pattern active + strong reversal indication with big volume spike after 7-8 years, 70 million vs Avg 13million weekly volume..
R 1: 180
R 2: 210
R 3: 240, Above that 270 + possible!
Harmonic Patterns on Aavas Financiers LtdIn this article, we will examine the current chart of Aavas Financiers Ltd. (NSE:AAVAS) and explore two prominent harmonic patterns: the Bat pattern on the weekly chart and the Black Swan pattern on the daily chart. Additionally, we will analyze the Relative Strength Index (RSI) on both timeframes to gain further insights into the potential market direction and strength.
Weekly Chart - Bat Pattern:
The weekly chart of Aavas Financiers exhibits a Bat pattern, a popular harmonic pattern used by