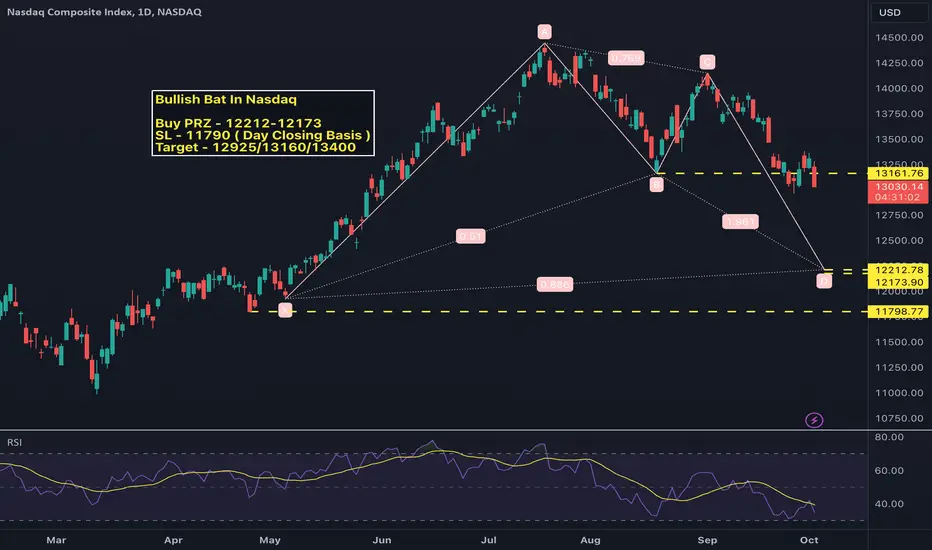
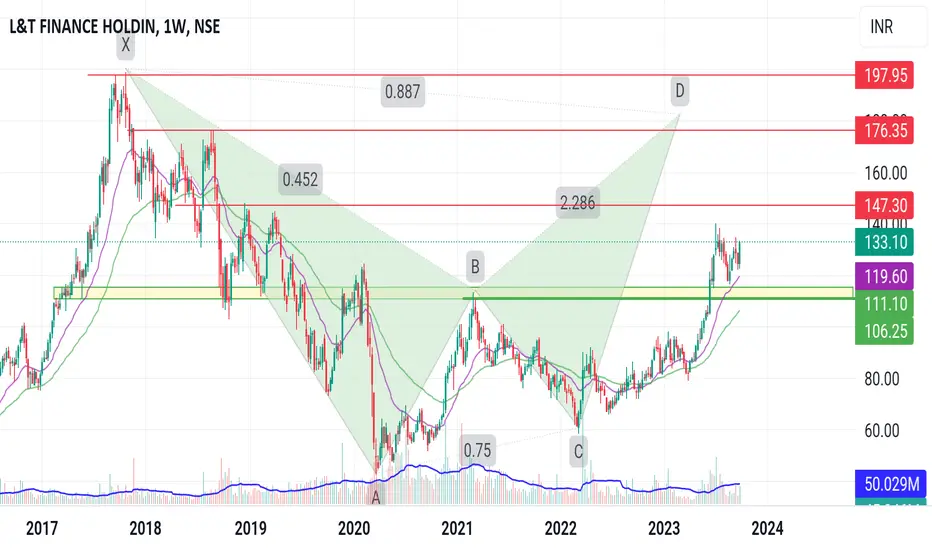
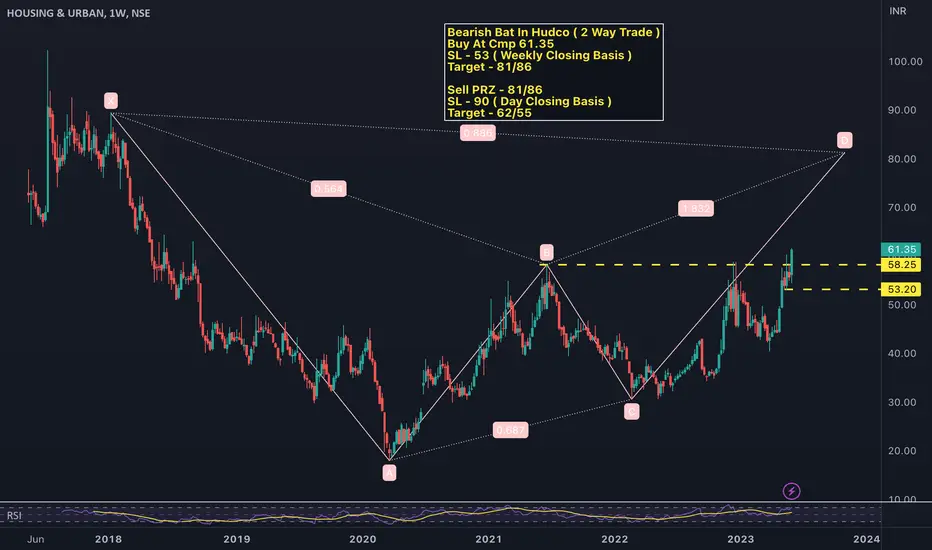
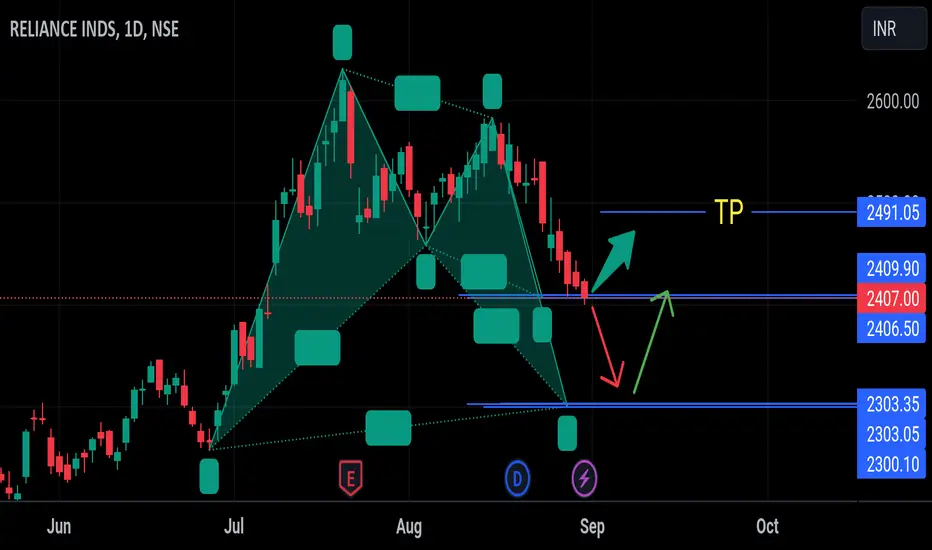
Harmonic Bullish Pattern active in Edelweiss Edelweiss looks Attractive for high risk takers
Fundamentals : Decent, stable on Sales, Profits and EPS but DII and FII stake decreasing. High debt vs Reserve.
Technicals : Very Bullish, Harmonic Bat active, well placed above standards MAs , heavy volume seen on recent breakout!
R 1: 76
R 2: 95
R 3: 115+
SL : 45
Bat
BLISSGVS's Chart: Bullish Breakout and Potential Bat HarmonicIn this analysis, we will conduct a detailed examination of BLISS GVS's weekly chart, highlighting the breakout of the falling trendline and the potential formation of a Bat Harmonic Pattern. We will assess the potential buying opportunity for BLISS GVS based on these technical signals. Let's proceed with the analysis.
Chart Analysis:
The TradingView chart for BLISS GVS reveals significant technical factors that may impact the stock's price action.
Breakout of Falling Trendline:
BLISS GVS'
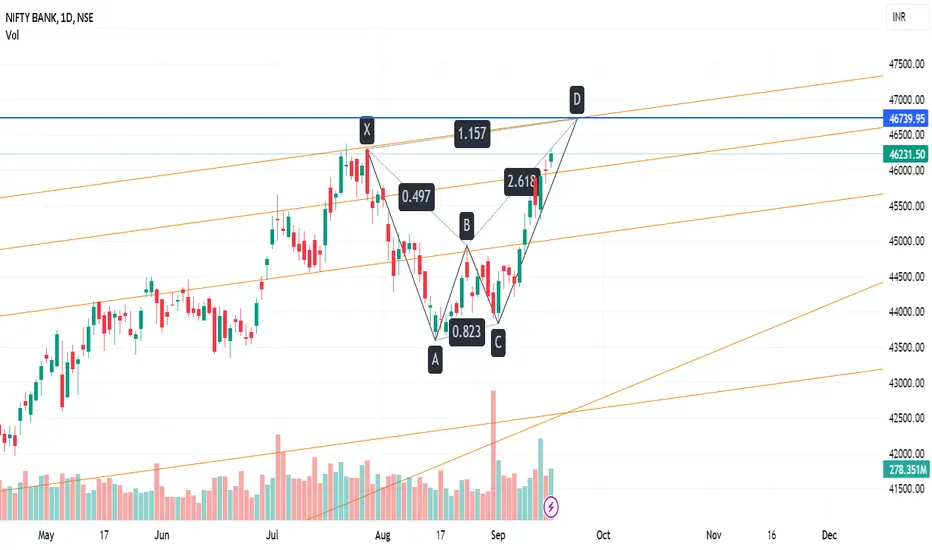
46,740 , an important level to watch for BankniftyA bat formation is in action,
and 46,740 is the level where we can see a break,
its also a trendline resistance.
so 25th Sept is the day when we can see this levels coming..
The Bat formation is a five-point harmonic pattern that can be used to identify potential reversals in price. It was discovered by Scott Carney in 2001 and is based on the Fibonacci retracement levels.
The Bat pattern consists of the following five points:
X: The start of the pattern.
A: A sharp price move in one direct
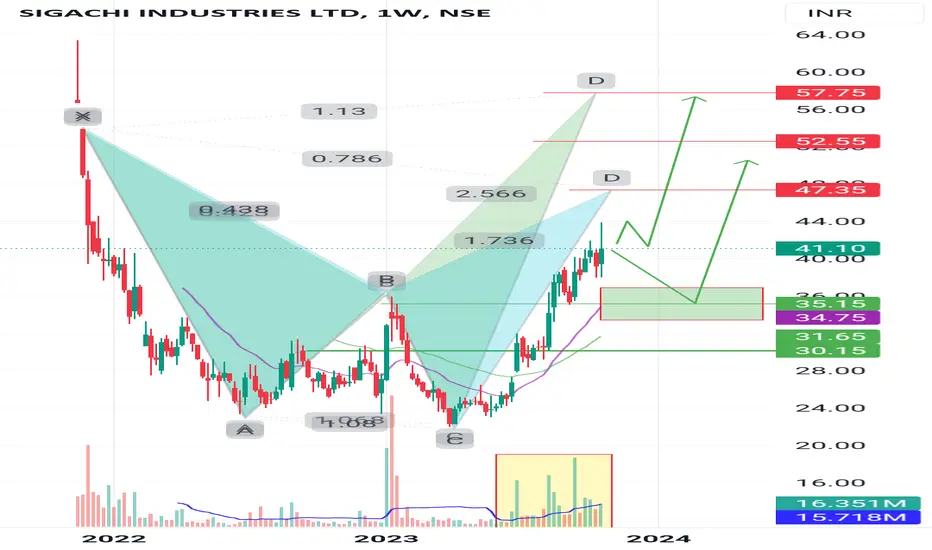
Sigachi Industry Bullish Harmonic Bat Pattern activeWeekend Pick 3: Sigachi
Fundamentals : Strong CAGR, Consistent Growth on Sales, Profits and EPS. Strong Reserves vs almost debt free !
Technicals : Bullish Harmonic Bat Pattern active. Good volumes.
R 1: 47
R 2: 52
R 3: 57++
Avg bet 35-33 if retests/falls , SL : 29.5
GBPUSD NEW ANALYSIS Trade Idea: SELL
📍 Entry: 🎯 Target: ⛔ Stop Loss: (MARKED IN CHART)
💡 RISK REWARD 1 :
💰 Risk 1% of your trading capital.
⚠️ Markets can be unpredictable; research before trading.Disclaimer: This trade idea is based on Elliott Wave analysis and is for informational purposes only. Trading involves risks; seek professional advice before making any financial decisions.Informational onLY !!!!
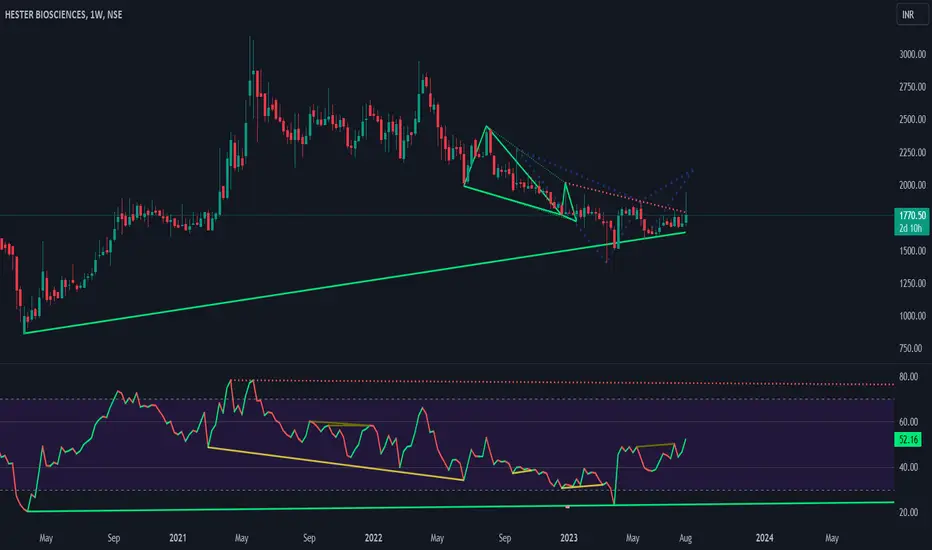
HESTERBIO's Chart: Breakout, Retest, and Harmonic PatternsIn this analysis, we will explore HESTERBIO's weekly chart, focusing on the breakout, retest, and the potential completion of Bat and Butterfly Harmonic Patterns. We will evaluate the potential trading opportunity for HESTERBIO based on these technical signals. Let's dive into the analysis.
Chart Analysis:
The TradingView chart for HESTERBIO provides insightful technical insights that could influence the stock's price action.
Breakout and Retest of Falling Trendline:
HESTERBIO's weekly cha