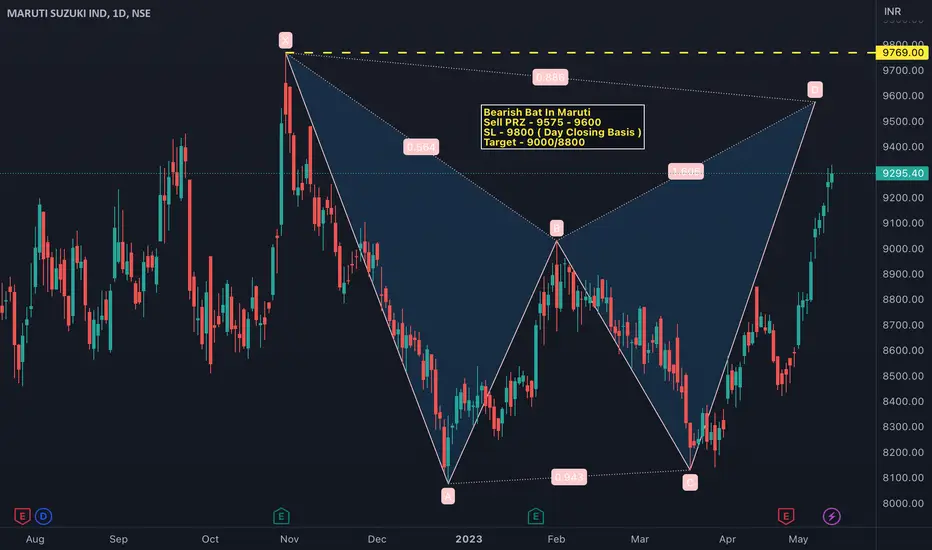
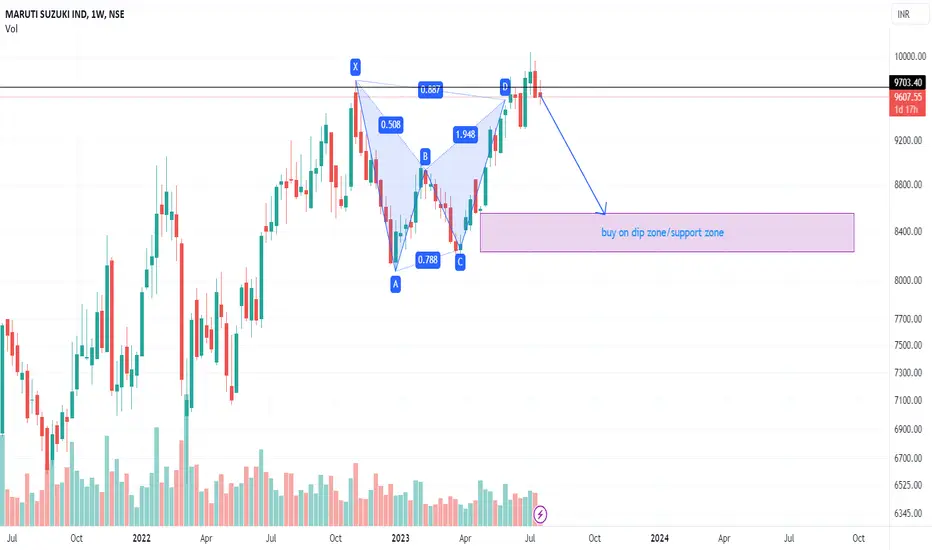
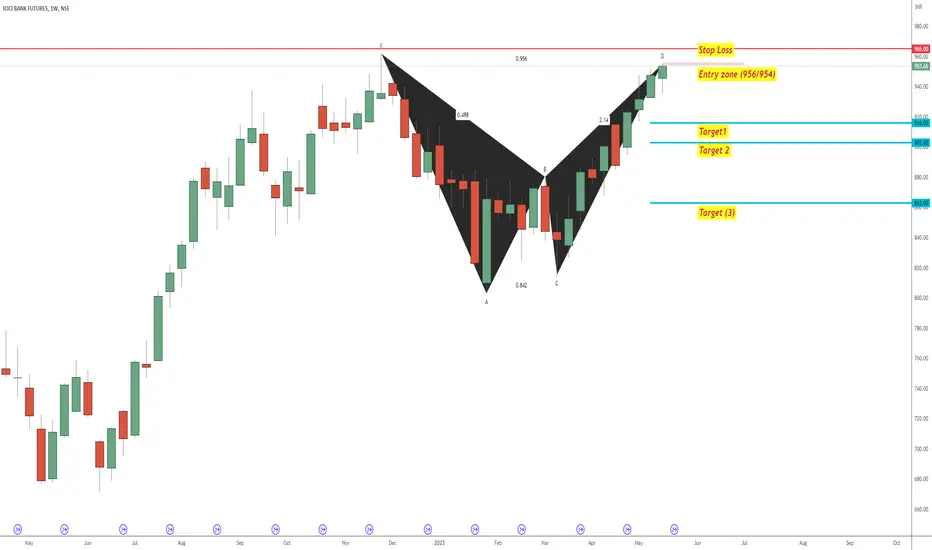
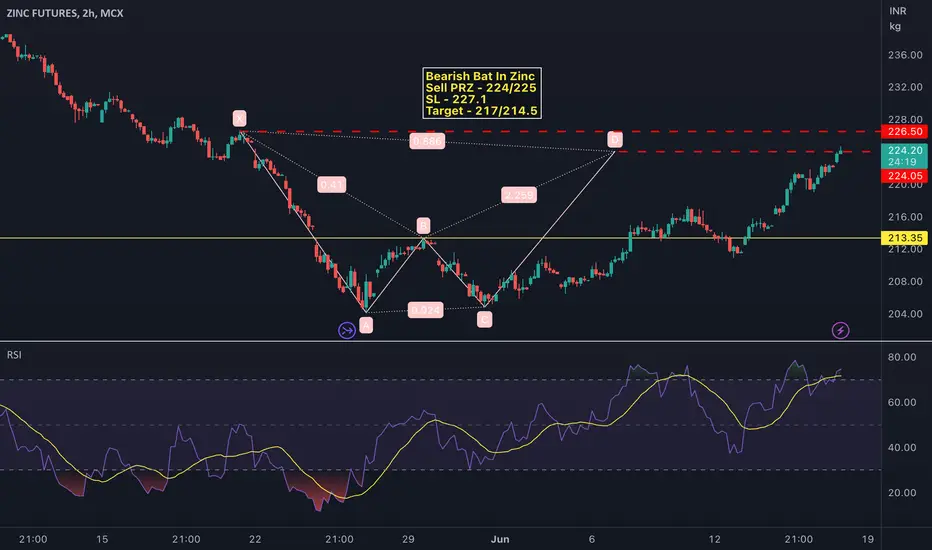
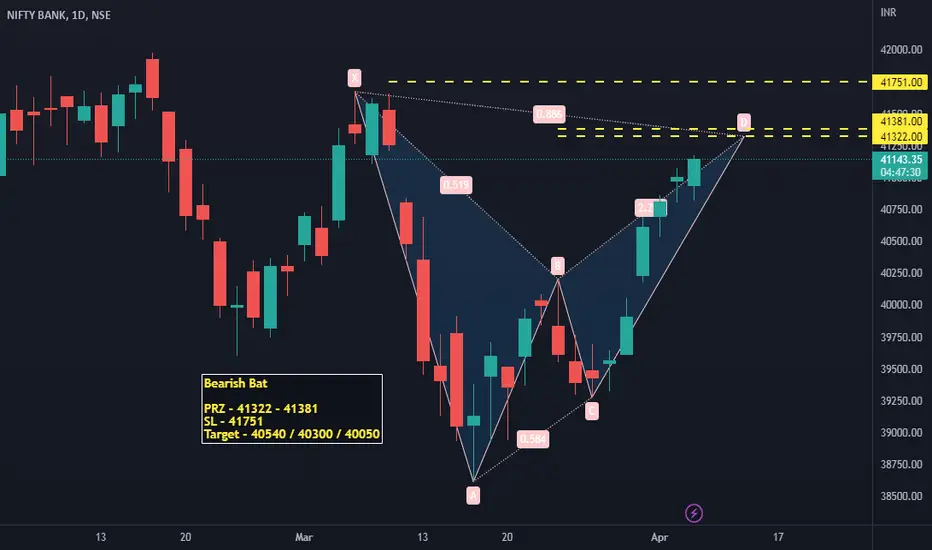
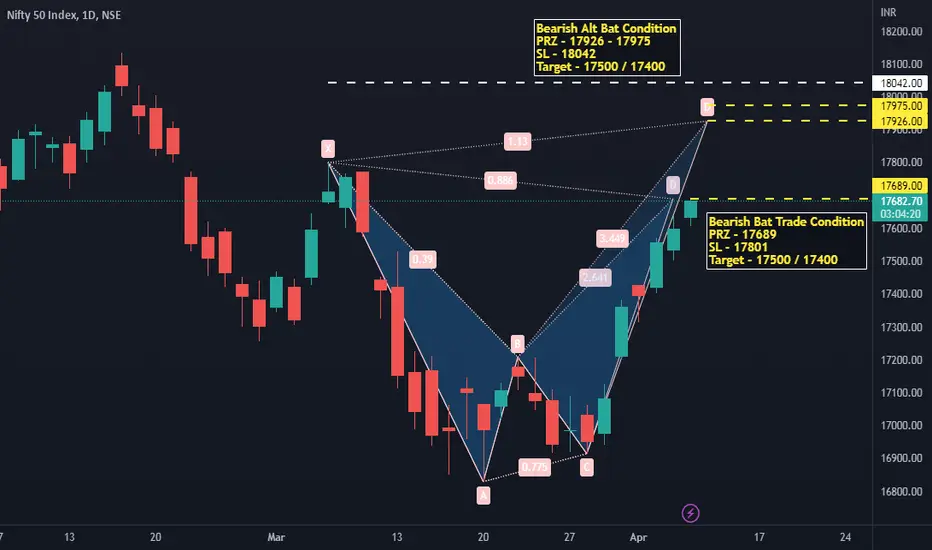
Bat
bearish bat in maruti currently at resistance zone can take less quantity in maruti and can add on dips or better buy when price reaches buy zone
maruti is near to previous high .. ,has not given much returns from last two years has come with new lauch of cars but in short term it might take time to reflect so if long term can add on dips or wait for maruti to correct
disclaimer- this is not any investment call or idea , this just my view and it can go wrong ,this is only for educational purposes trade at your own risk :)
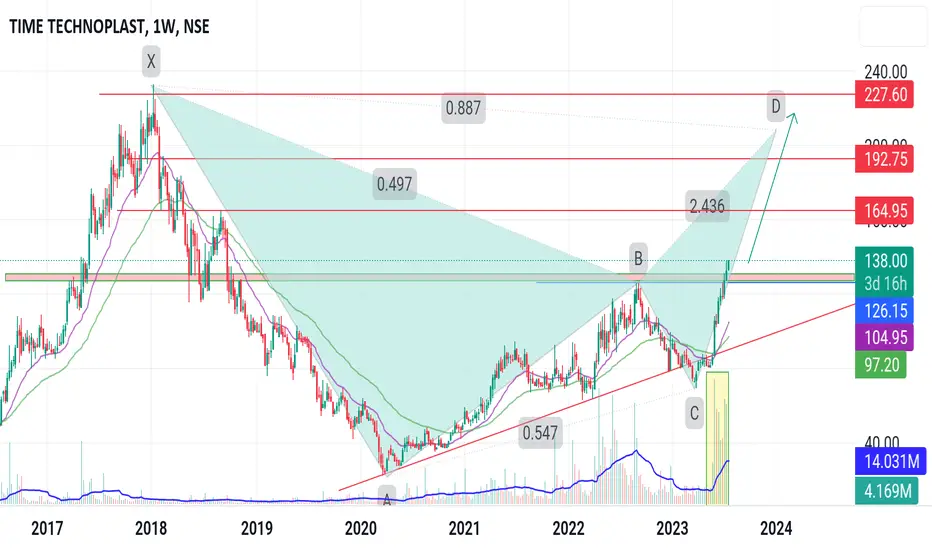
Time Technoplast looks Attractive Harmonic Bat ActiveTime Technoplast looks Attractive for high risk takers
Fundamentals : Decent and improving, consistent on Sales, Profits and EPS but DII and FII stake decreased recently.
Technicals : Bullish, Harmonic Bat active, well placed above standards MAs , heavy volumes !
Target 1: 165
Target 2: 190
Target 3: 225+
Stop loss : 105
Symphony Stock - Alternative Bat Formation and Weekly TrendlineIn this trading analysis, we will explore the potential trading opportunities presented by Symphony stock (SYMPHONY) based on the formation of an alternative bat pattern on the daily timeframe and the presence of a trendline support on the weekly chart. We will discuss the key technical aspects, entry levels, target prices, and stop loss levels to assist traders in making informed decisions.
Alternative Bat Formation on Daily Basis:
Upon examining the daily chart of Symphony stock, we observe
Bearish Harmonic Forming In Crude OilREAD CAREFULLY !!!
Crude Cmp - 5788
Bearish Bat PRZ - 5986/5991
SL - 6055
Target - 5830/5790
( It means Crude may move 200 points up from
here, so one can buy it with sl of 5724 )
Bearish Deep Crab PRZ - 6378
SL - 6431
Target - 6078/5990
( It means if crude breaks 6055 level it can
further move 320 points up )
JKLAKSHMI's Anti-Shark and Bat Patterns, Potential TargetsIn this post, we will conduct a comprehensive analysis of JKLAKSHMI, focusing on the formation of the anti-shark and bat patterns on the chart. Additionally, we will consider the impact of a rumored reduction in Goods and Services Tax (GST) on cement products, which could potentially influence the stock's performance. Let's delve into the analysis and gain insights into the situation.
Chart Analysis:
Upon examining the provided TradingView chart for JKLAKSHMI, we can observe the formation of
COPPER Candlestick with Trendline with Moving average with Chart pattern with Elliott wave with Harmonic patterns study with copper
i just want to show here it does'nt matter what you know what you use.its important how perfect you are in your study.
why i ve buy this @ 620 on sept expiry.
and what my next view...
Huhtamaki Ind Bullish Harmonic ActiveWeekend Pick 2: Huhtamaki Ind
Fundamentals: Decent, consistent on Sales, Profits, EPS, Growing Reserves Vs reducing debts. FII holding increased slightly. Healthy Dividends
Technicals: Harmonic XABCD Active with Good Volume, Price above standard MAs
R1: 295
R2: 325
R3: 355.. Above 360 big rally if sustains on weekly chart
SL: 225
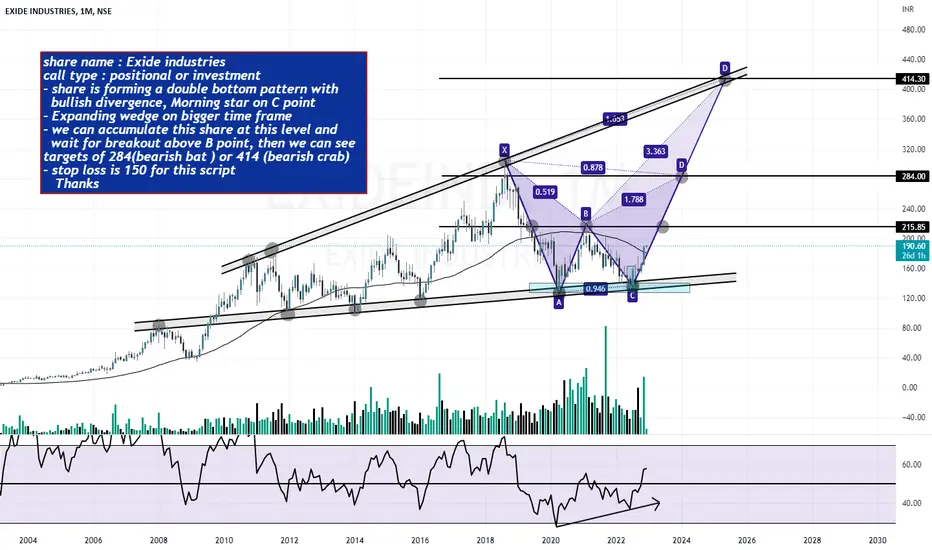
EXIDE INDUSTRIESshare name : exide industries
call type : positional or investment
- share is forming a double bottom pattern with
bullish divergence, morning star on c point
- expanding wedge on bigger time frame
- we can accumulate this share at this level and
wait for breakout above b point, then we can see targets of 284(bearish bat ) or 414 (bearish crab)
- stop loss is 150 for this script
thanks
LAXMI ORGANIC - 77% RETURNS!!!BUY - LAXMI ORGANIC INDUSTRIES LTD
CMP - Rs. 265
Target - 1: Rs. 321
Target - 2: Rs. 377
Target - 3: Rs. 469
.
.
Technicals -
1) Bullish Bat, Sea Pony, Anti Nen Star Harmonic Patterns.
2) Trendline Breakout
.
.
Fundamentals -
1) Sales growth is growing at a healthy rate in the last 3 years 27.94%.
2) Net Profit is growing at a healthy rate in the last 3 years 38.96%.
3) Sales growth is good in the last 4 quarters at 24.95%.
.
.
Follow me for more!
.
.
This is a view by an expert analyst, p