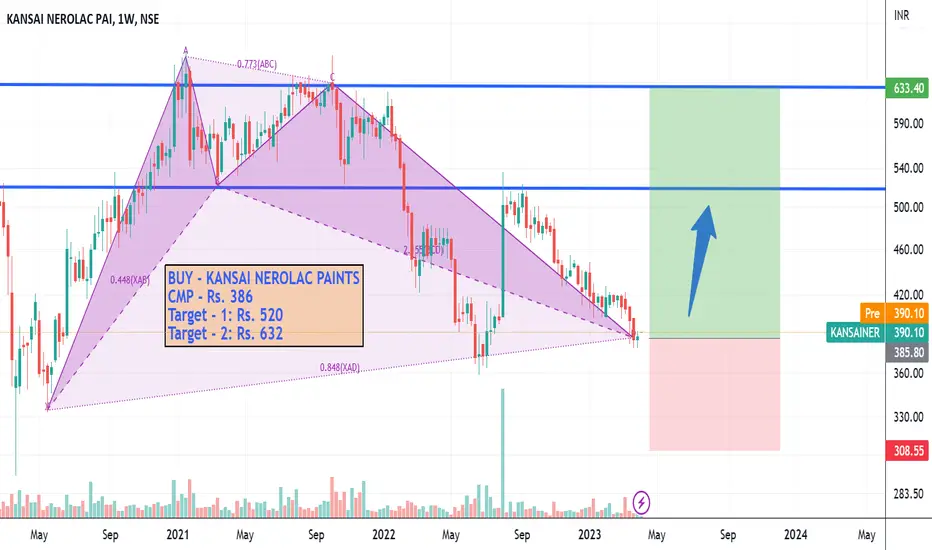
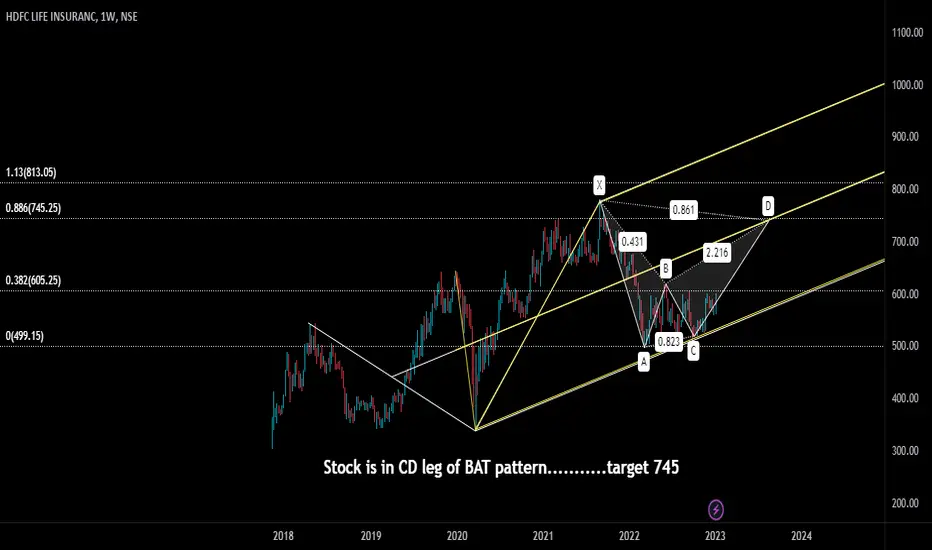
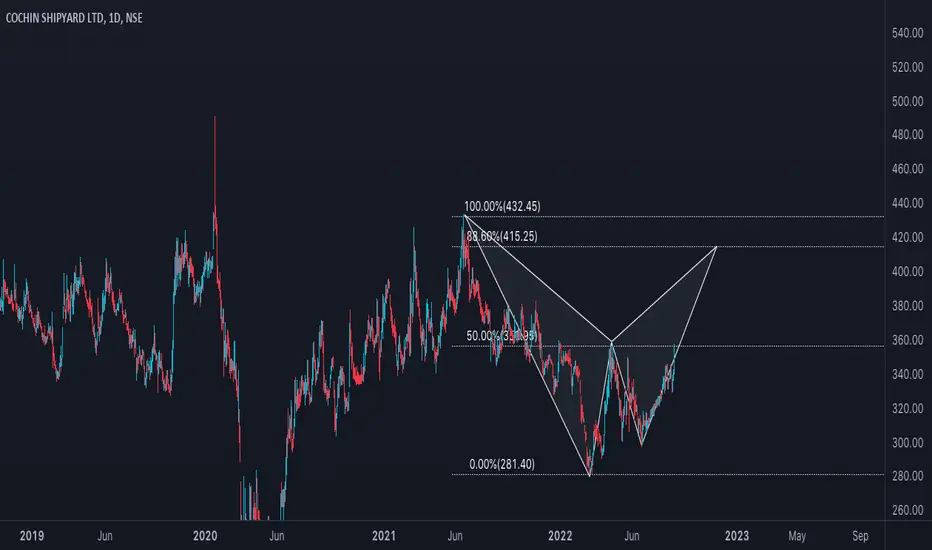
Bat
SUZLON ENERGY - 65% RETURNS!!!BUY - SUZLON ENERGY LTD
CMP - Rs. 7
Target - 1: Rs. 9
Target - 2: Rs. 10.65
Target - 3: Rs. 11.65
.
.
.
Technicals - 1) Bullish Bat Harmonic Pattern.
2) Targets set using Fibonacci Retracements.
.
.
Comment: Target - 3 will be achieved in 4-8 months.
.
.
Follow me for more!
HITACHI ENERGY INDIA LTD : SUMMERS HAVE KNOCKED THE DOORHitachi Energy India Ltd is an India-based power technology company, which is engaged in the business of power technologies and provides a range of grid portfolios across the entire value chain. As Summers are approaching , the stock has started showing off its mood. We have seen a breakout at triangle formation. Entry to be taken only after Re-testing of the support at 3184.90.
Awesome Oscillator indicator also showing trend line broken indicating an upward movement.
Long Term target is 4
INDUS TOWERshare name : Indus towers ltd
call type : positional
- we can see a double bottom. bullish engulfing candle on weekly and monthly time frame also.
- share is forming a bearish bat pattern with
descending triangle pattern
- on support area around 180 (a good
consolidation can be seen)
- approachable targets 230, 259 with sl of 175
thanks
Bearish Double Top - Capital Goods Index - Expect CorrectionStraight Double Top Bearish Pattern on Capital Goods Index - Note this is on weekly timeframe
SL for shorts mentioned
All targets on the chart
Expect downside correction of 10 to 20 % over next 5 to 8 weeks
The index consists of 25 stocks - 8 FnO Stocks & 17 Cash Stocks. Constituents are -
ABB India Ltd
AIA Engineering Ltd
Bharat Electronics Ltd
Bharat Forge Ltd
Bharat Heavy Electricals Ltd
Carborundum Universal Ltd
Elgi Equipments Ltd.
Finolex Cables Ltd
Graphite India Ltd.
Reliance at a crucial levelBroken long tern trendline, can it regain it?
Will reliance take support on the neckline or break it?
RSI on hourly chart shows positive divergence
I think it will bounce from here or will it take nifty to lower levels along with it.
Can be weak after a close below 2285
Stay tuned
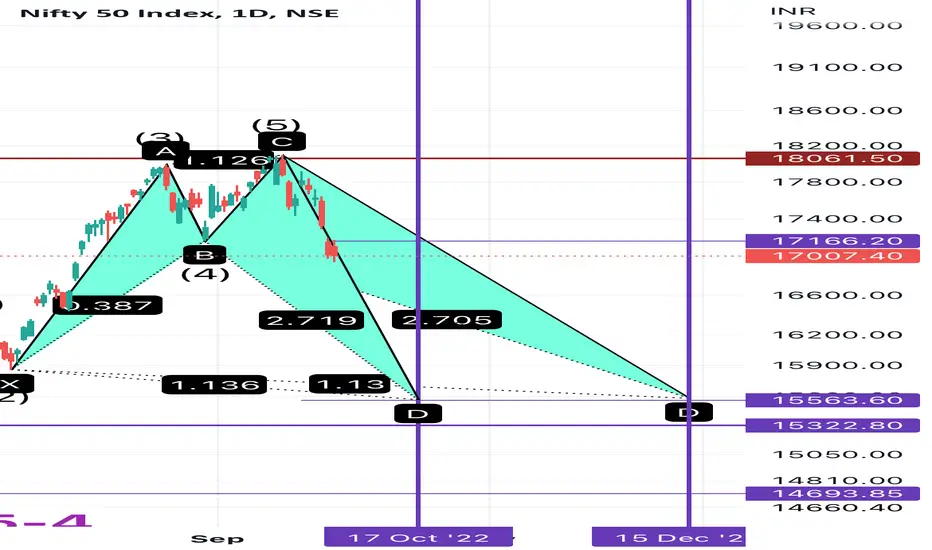
Bullish Bat in MCXRules of bullish bat
B retraces 0.382 to 0.5 of XA.
BC retraces 0.382 to 0.886 of AB.
CD is a 1.618 to 2.618 extension of AB
D is at a 0.886 retracement of XA
But in our chart there will be small differences and deviation but according to the adjustments the ratio need to be matched .
However with perfect ratios it is rare to find but most of the time with some deviation it works
Bullish Bat in hdfcRules of bullish bat
B retraces 0.382 to 0.5 of XA.
BC retraces 0.382 to 0.886 of AB.
CD is a 1.618 to 2.618 extension of AB
D is at a 0.886 retracement of XA
But in our chart there will be small differences and deviation but according to the adjustments the ratio need to be matched .
However with perfect ratios it is rare to find but most of the time with some deviation it works
HLong