BEARISHNESS in JUSTDAIL (Positional)NSE:JUSTDIAL
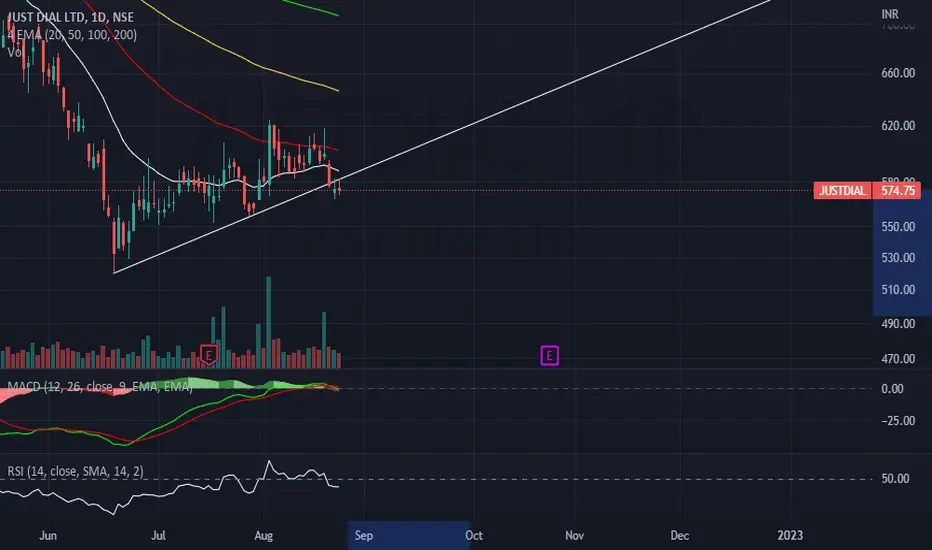
Justdial stock is looking bearish to me. The stock price has breakdown from the Trendline. This price is trading below the moving averages which shows bearishness. The MACD has given a bearish signal. The RSI is also below 50 which show weakness. This view is for 1 to 3 months. The SL Level for this stock is around 615 level, and the Target is around 495 levels.
Disclaimer : This is my own view and analysis. This is for educational purposes. This is not a recommendation, call or
Bearish Patterns
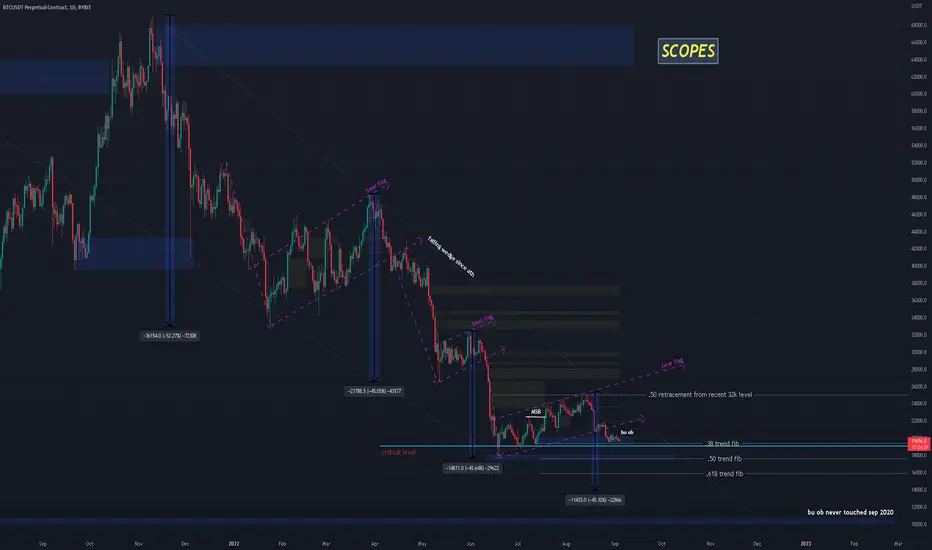
btc the daily horrible analysis lower prices look very real hi guys
just a quick overlook on the daily btc chart from ath horrible sight to see three bear flags one after the other inside of a falling wedge since atheach time we broke previous flags we had near enough the same drop of around 45% we have broke out of our latest flag are we going to see another 45% drop in price to the 14k mark its possible given the conditions we are in or even are we going to see a double bottom form at 17k then bounce do i think the bottom is in i dunno it looks unlikl
finding Tops | Nifty Targets | Crash - Hedge yourself !!This is How I try to learn to catch Tops and bottom, Market is like an "Infinite Sea"- full of earnings & looses.. but beauty of this sea is that it behaves in a systematic manner like a nature which is very well explained in Elliot Wave theory and Neo Wave theory .
A good entry and exit always gives u maximum return and vice versa for that u really need to have patience and principles while jumping into this "financial SEA"
like I have shared charts where market gave u signal of exit a
Bearish upto 500 support There is making pattern since long time.. up - down its trying to break 550 level but could not break and taking support at 445 again and again..
So now again it come fall from 542 and may take support at 500 or 490 and then will break out new level.
#long for Week view its RSI shows to down direction
#short for 2-4 hours its down direction
So lets see we make it closer to our prediction or execute stop loss
thanks
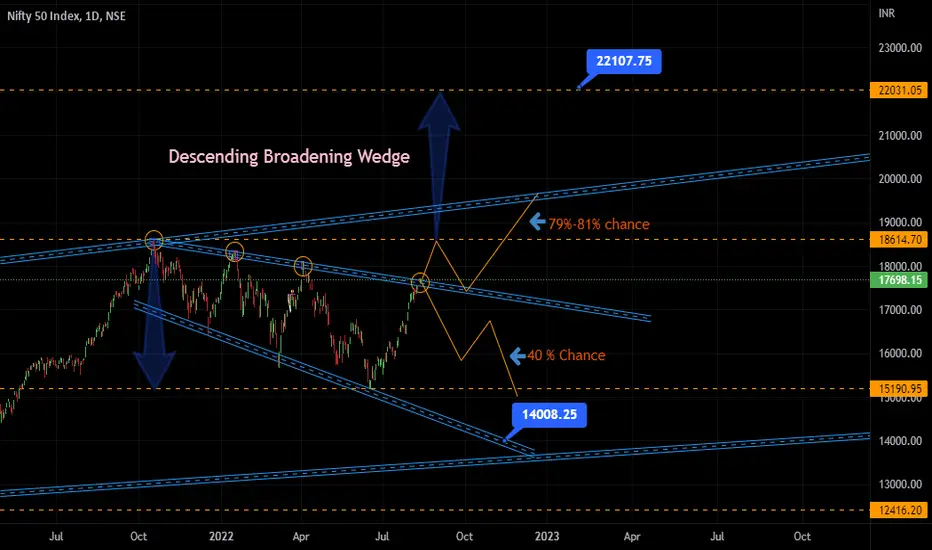
NIFTY 50 on a MAJOR AREA ( 22000 or 14000)We can see a clear pattern formation.
Its a Descending Broadening Wedge.
Normally Its a Continuation pattern that means earlier market made a top on 18600 and now if price will break this wedge again it will continue the bull rally.
Still there are chances of failure of this pattern.
DOUBLE TOP REVERSAL PATTERN FORMATION IN MAHINDRA AND MAHINDRAM & M had shown a very promising rally from last few weeks. As per chart it seems that the bullish trend has come to an end and we could see a double top reversal pattern on charts. In short term we can see 1200 levels. one can take entry now with SL at 1282 for targets of 1200 in 3-4 trading sessions.
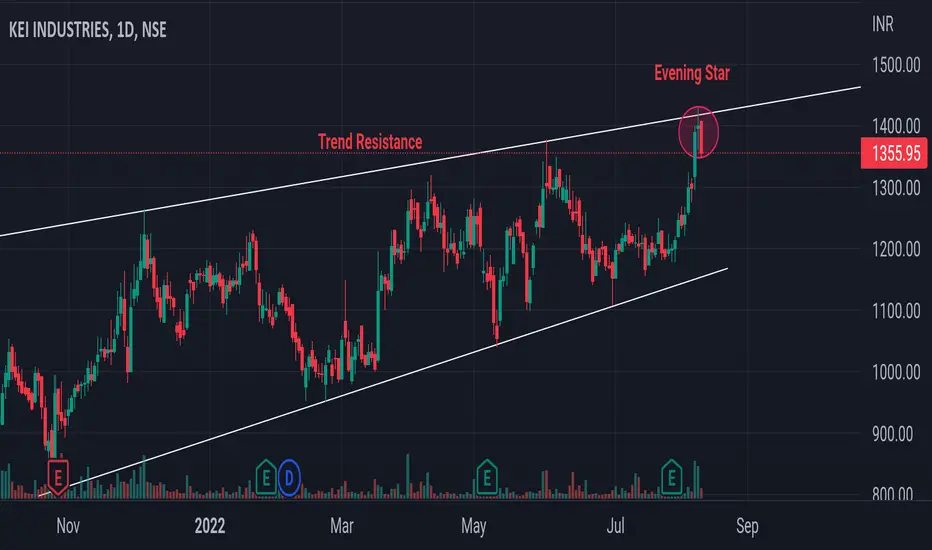
KEI INDUSTRIES - WEAKNESS?Evening Star pattern has been formed near Trend Resistance inD1 Timeframe. Evening Star pattern shows a trend reversal if it's formed near resistance. In M30 timeframe, Head and shoulder pattern has been formed. So closing below 1350 may show some weakelness.
Disclaimer :- I'm not a SEBI registered analyst. This are my personal view. Information given is for educational purposes only. Do your own analysis before investing.