EURGBP trade Idea, sell on rise!📊 TRADE SETUP
Instrument: EURGBP
Direction: SELL
Entry: 0.85239
Stop Loss: 0.85439
Take Profit: 0.85039
Risk: 20 Pips
Reward: 20 Pips
Risk:Reward = 1:1
Nano Lot → 0.001 Lot → 100 Units → +£0.20 (20 Pip Target) → -£0.20 (20 Pip SL)
Micro Lot → 0.01 Lot → 1,000 Units → +£2.00 (20 Pip Target) → -£2.00 (20 Pip SL)
Mini Lot → 0.10 Lot → 10,000 Units → +£20.00 (20 Pip Target) → -£20.00 (20 Pip SL)
Standard Lot → 1.00 Lot → 100,000 Units → +£200.00 (20 Pip Target) → -£200.00 (20 Pip SL)
For Educational Purposes only, Not an Investment Advice, Always use strict Risk management measures.
Regards CrazyTrades247.
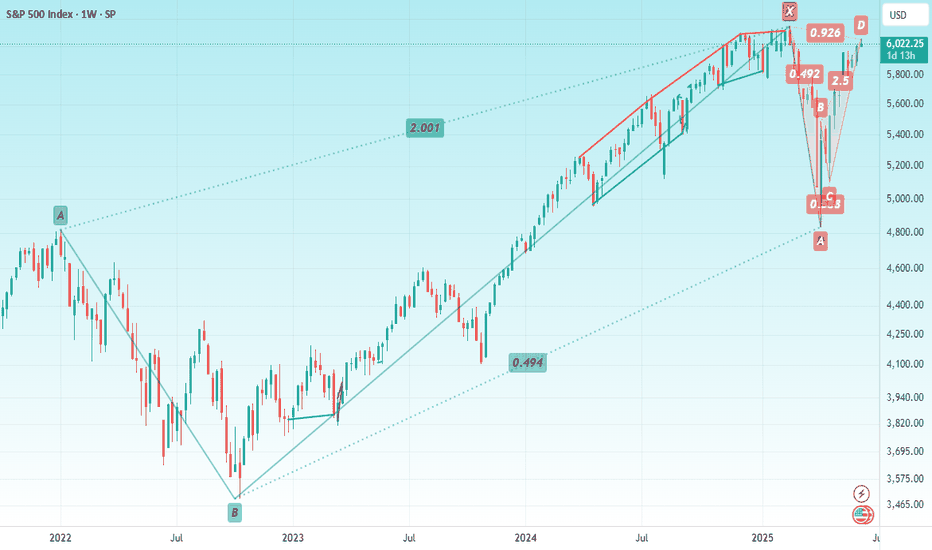
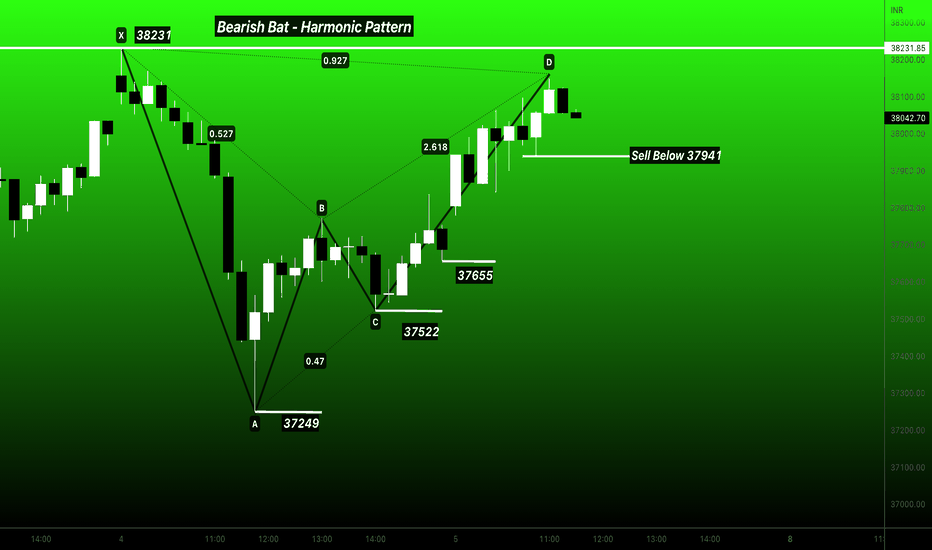
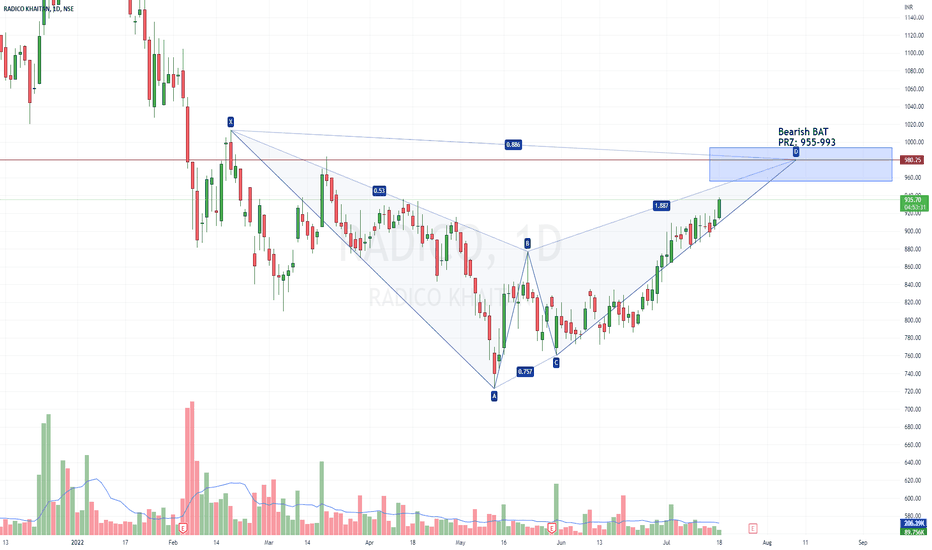
Bearish Bat
XAU/USD (Gold) – Bullish vs Bearish Scenario (Intraday)Gold is trading near $4428 with mixed momentum, but overall structure still leans bearish unless key resistance breaks.
Bullish Scenario
If price breaks & sustains above 4441
Upside targets: 4458 → 4472 → 4490
Momentum buying can trigger short covering rally
👉 Bias turns bullish only above 4450+ hold
Bearish Scenario (Primary)
If price rejects near 4435–4445
Downside targets: 4407 → 4389 → 4355
Indicators & MAs still favor selling pressure
👉 Bias remains bearish below 4441
Intraday Plan
Sell on Rise: 4435 – 4445 | SL: 4470 | TGT: 4410 / 4390
Buy on Breakout: Above 4450 | SL: 4420 | TGT: 4470 / 4490
🧠 Conclusion
Market is bearish-biased, but a breakout above resistance can shift momentum short-term.
⚠️ Disclaimer
This is for educational purposes only. Trade with proper risk management.
XAUUSD Outlook : Bull vs Bear | 23rd March'2026Gold (XAU/USD) is currently under strong bearish pressure, trading around $4243, marking a sharp decline of over -5.5%. The market structure clearly shows aggressive selling with all major timeframes (Hourly, Daily, Weekly) aligned on the sell side. Moving averages (MA5–MA200) are fully bearish, confirming a strong downtrend.
Technical indicators also support the downside — MACD, ADX, ROC, and Momentum indicators are signaling continued selling pressure. However, oscillators like RSI (11) and CCI (-219) indicate that gold is in a deep oversold zone, which increases the probability of a short-term pullback or consolidation before the next move.
Key Levels to Watch
Support Zones: 4233 → 4147
Resistance Zones: 4387 → 4453 → 4540
Bearish Scenario
Gold remains in a strong downtrend, and as long as price stays below the 4300–4387 resistance zone, selling pressure is expected to continue. A breakdown below 4233 can trigger further downside toward 4147, with potential panic selling extending losses. Overall trend stays bearish unless a clear structural reversal forms.
Bullish Scenario
Gold is currently in a deeply oversold condition, which may lead to a short-term relief rally. If price manages to break and sustain above 4387, a bounce toward 4450–4540 levels is possible. However, this move would likely be a temporary pullback, not a full trend reversal unless strong bullish confirmation follows.
XAU/USD (Gold) | MARKET OUTLOOK | 20th Macrh'2026Gold is trading near 4679 with a minor bounce, but overall trend remains bearish as higher timeframes and indicators show strong selling pressure. The current move looks like a short-term pullback, not a reversal.
Key Levels
* Resistance: 4680 – 4725
* Support: 4628 – 4584
📉 Bearish View
* Below 4680–4700, expect downside continuation → 4628 → 4584
📈 Bullish View
* Above 4725, short-term bounce possible → 4778
Strategy
* Prefer Sell on Rise
* Buy only on confirmed breakout above 4725
Conclusion
Trend is bearish, focus on selling unless breakout happens.
⚠️ Disclaimer : For educational purposes only. Trade with proper risk management.
BTCUSDT Technical Analysis (1H Timeframe)BTCUSDT is showing a bearish structure on the 1H timeframe, with price rejecting strongly from the 71,300–71,800 supply zone and forming lower highs. The recent upside move looks corrective, and price is failing to hold above previous demand, signaling weak bullish momentum.
The key area to watch is 68,888. A breakdown below this level confirms continuation to the downside, with liquidity resting below recent lows. The next major demand zone sits between 68,000 and 67,200, aligning with prior reactions and imbalance.
Trade Setup:
Sell below 68,888 | TP1: 68,000 | TP2: 67,222 | SL: 70,222
Bias remains bearish below 70,200; bullish control only above 71,800.
Disclaimer:
This analysis is for educational purposes only and does not constitute financial advice. Cryptocurrency trading involves significant risk, and losses may exceed your investment. Always do your own research and manage risk properly before entering any trade.
XAUUSD (Gold Spot) Technical Outlook - 17/12/2025XAU/USD – Technical Update
Gold trades near $4,332 and remains in a strong bullish trend across all timeframes, supported by price holding well above key moving averages. Momentum is strong, though short-term indicators are overbought, hinting at minor pullbacks.
Key Levels:
Support: 4300–4305 | 4290 | 4270
Resistance: 4335 | 4367 | 4400
Intraday Strategy:
Buy dips: 4300–4310
Targets: 4335 → 4365
SL: Below 4270
Fundamentals:
US macro data & Fed expectations keep gold supported amid cautious risk sentiment.
Bias: 📈 Bullish trend | Buy on dips
Disclaimer:
For educational purposes only. This is not financial advice. Trading in Forex, Gold, Crypto, and markets involves high risk. Do your own research and trade at your own risk.
GOLDHello & welcome to this analysis
In 4hrs time frame GOLD (MCX) has activated a bearish Harmonic Bat pattern.
It could retrace down to 99500 - 98500, will consider 100750 as stop loss for this set up.
Do keep in mind, GOLD overall is very strong and this could likely be a shallow retracement.
Regards
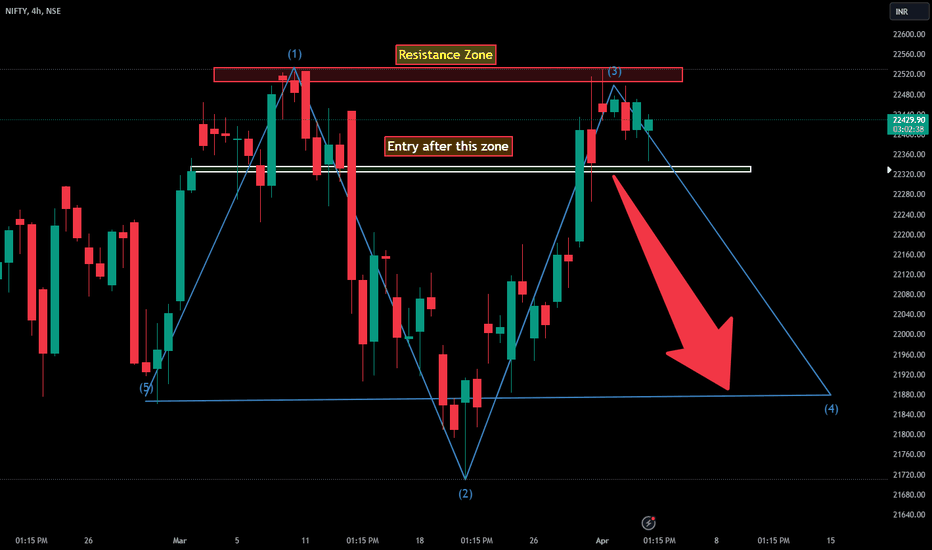
NIFTY MONTHLY BAT PATTERN OR HALF M PATTERN (Condition apply)* The market (NIFTY50) is currently trading at 22436. However, it's important not to blindly follow the buy or call side under the yellow box, as it signifies a sideways zone. For the past two days, I've observed a sideways market with premiums not showing significant increases.
Here are the levels and analysis for the NIFTY Monthly Future Traders:
Once the 22400-440 Level breaks then the Market will go towards the 21900 Level again.
If it sustains 22000 then also no big issue.
Note: Selling side momentum can be captured effectively as selling often yields better results than buying. However, it's crucial not to be biased towards any side. Wait for a level break and then align with the market. The market will consistently provide favorable outcomes, whether in terms of profit or learning.
BankNifty - The Last Leg in Bearish Bat 45600 to 47000 Disclaimer:
Trading in financial markets involves substantial risks. Please consult your financial advisor before making any trading decisions. This message is not a solicitation to buy or sell. Perform your due diligence.
WaveTalks - Market Whispers: Can you hear them?
As discussed in the last idea today - 19th jan 2024 during last hour of trading. Index holded 45550-45600 zone rallied upside towards 45700+
We suggested to have patience & buy close to 45600
Strict Stops below 45550
Happy Saturday Trading !!!
Gnfc chart studyGnfc spot around 755
weekly time frame
Bearish bat pattern formation
exact text book pattern formation.
counter might face resistance going ahead,
keep buffer of 2% on higher side,
if sustains above that levels than view get negated,
else as per harmonic pattern counter might retrace by 7-10%
Bank Nifty futures Bearish harmonicbank nifty may have made a bearish bat.. Can sell near top for diff fibo level targets.. most probably .38
BShort
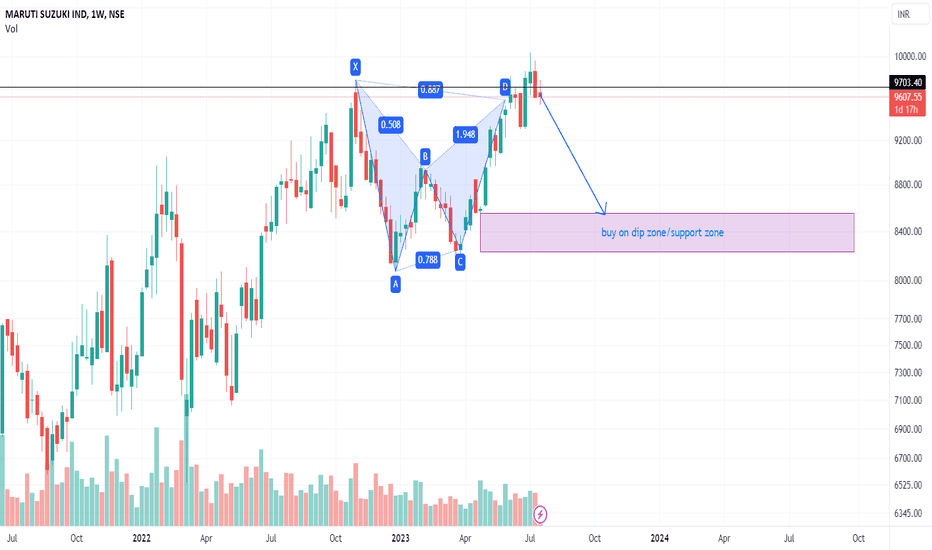
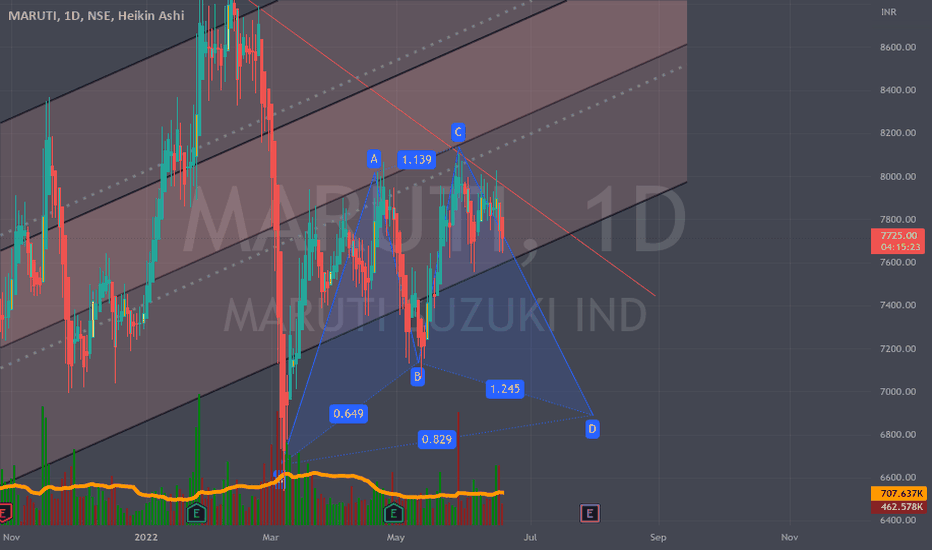
bearish bat in maruti currently at resistance zone can take less quantity in maruti and can add on dips or better buy when price reaches buy zone
maruti is near to previous high .. ,has not given much returns from last two years has come with new lauch of cars but in short term it might take time to reflect so if long term can add on dips or wait for maruti to correct
disclaimer- this is not any investment call or idea , this just my view and it can go wrong ,this is only for educational purposes trade at your own risk :)
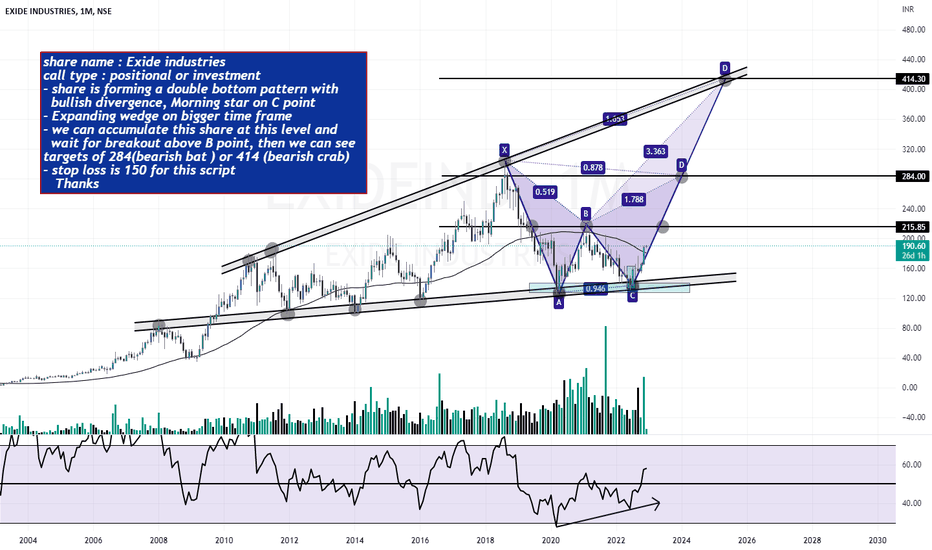
EXIDE INDUSTRIESshare name : exide industries
call type : positional or investment
- share is forming a double bottom pattern with
bullish divergence, morning star on c point
- expanding wedge on bigger time frame
- we can accumulate this share at this level and
wait for breakout above b point, then we can see targets of 284(bearish bat ) or 414 (bearish crab)
- stop loss is 150 for this script
thanks
INDUS TOWERshare name : Indus towers ltd
call type : positional
- we can see a double bottom. bullish engulfing candle on weekly and monthly time frame also.
- share is forming a bearish bat pattern with
descending triangle pattern
- on support area around 180 (a good
consolidation can be seen)
- approachable targets 230, 259 with sl of 175
thanks
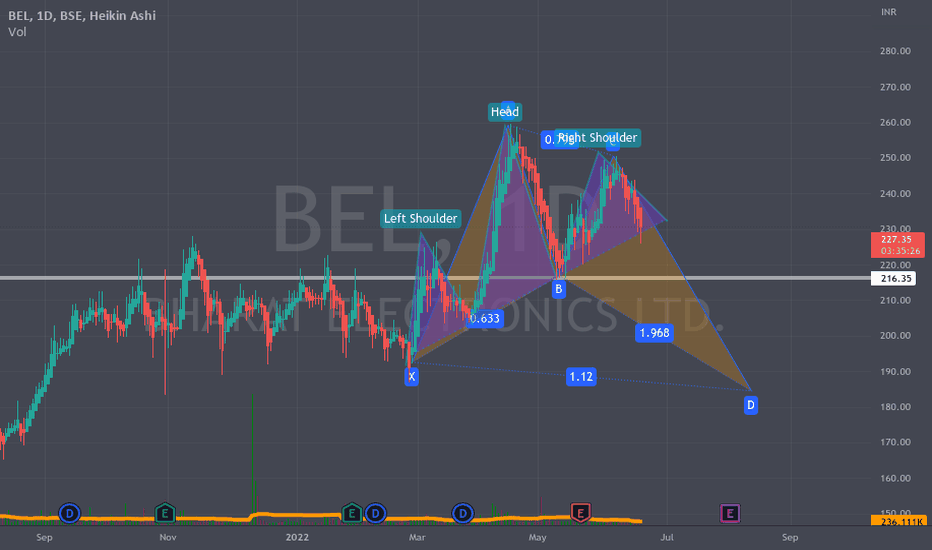
Bearish Double Top - Capital Goods Index - Expect CorrectionStraight Double Top Bearish Pattern on Capital Goods Index - Note this is on weekly timeframe
SL for shorts mentioned
All targets on the chart
Expect downside correction of 10 to 20 % over next 5 to 8 weeks
The index consists of 25 stocks - 8 FnO Stocks & 17 Cash Stocks. Constituents are -
ABB India Ltd
AIA Engineering Ltd
Bharat Electronics Ltd
Bharat Forge Ltd
Bharat Heavy Electricals Ltd
Carborundum Universal Ltd
Elgi Equipments Ltd.
Finolex Cables Ltd
Graphite India Ltd.
Grindwell Norton Ltd
Hindustan Aeronautics Ltd
Honeywell Automation India Ltd
KNR Constructions Ltd
Lakshmi Machine Works Ltd
Larsen & Toubro Ltd
Polycab India Ltd
Praj Industries Ltd
Schaeffler India Ltd
Siemens India Ltd
SKF India Ltd
Sona BLW Precision Forgings Ltd
Suzlon Energy Ltd
Thermax Ltd
Timken India Ltd.
V-Guard Industries Ltd
FnO Stocks are -
ABB India Ltd
Bharat Electronics Ltd
Bharat Forge Ltd
Bharat Heavy Electricals Ltd
Hindustan Aeronautics Ltd
Larsen & Toubro Ltd
Polycab India Ltd
Siemens India Ltd
Let's see which way the story unfolds. Happy Trading!
Disclaimer -
- The view expressed here are my personal views. I am publishing this for my own records and what I see on charts.
- If you're referring to this, please consider this ONLY FOR educational & research purposes.
- Past performance is not a guarantee for future predictions
- Any decision you take, you need to take responsibility for the same. DO NOT consider this as an investment suggestion.
- It's your hard earned money. Treat it wisely
- Trade / Invest keeping in mind your trading style, goals and objectives, time horizon & risk tolerance
- Do your own analysis and consult your financial advisor before investing.
TIA!
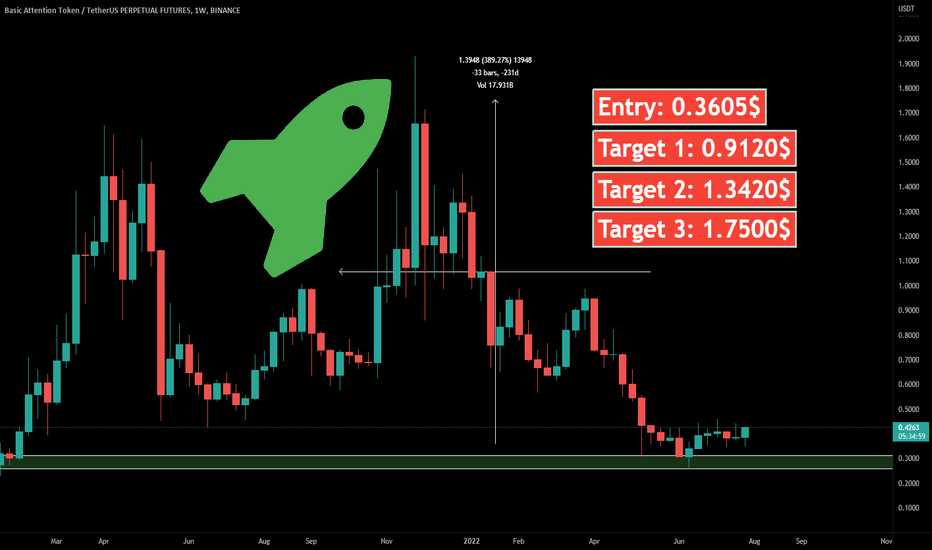
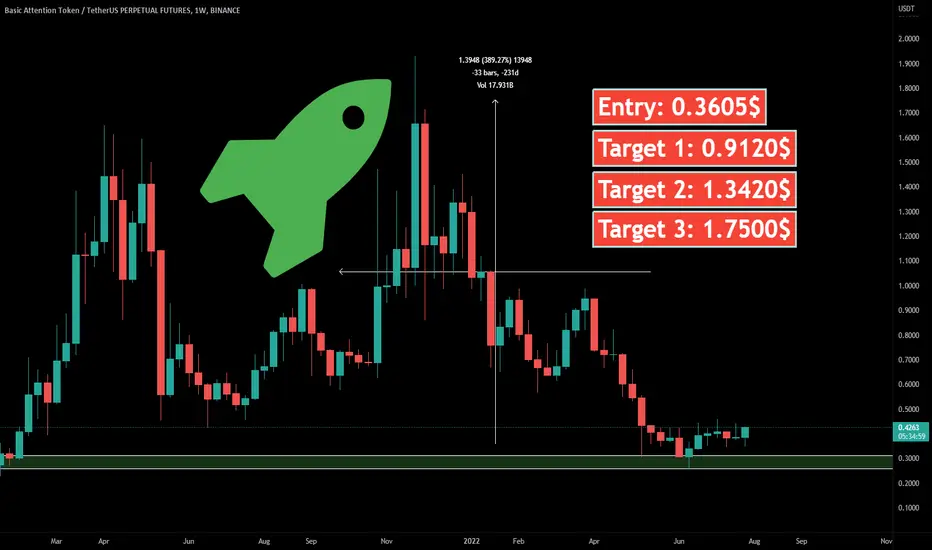
💎 BATUSDT : 389.27% Profit Potential in Next 6 Months💣💣💣💣last 2-3 weeks we seen huge buying in BAT coin, in upcoming months its to going pump very hard.
entry and targets are given on the chart. Treat this idea as long-term investment
please Like and comment if there are any queries.
#bitcoin #altcoinseason #altcoin #altnews