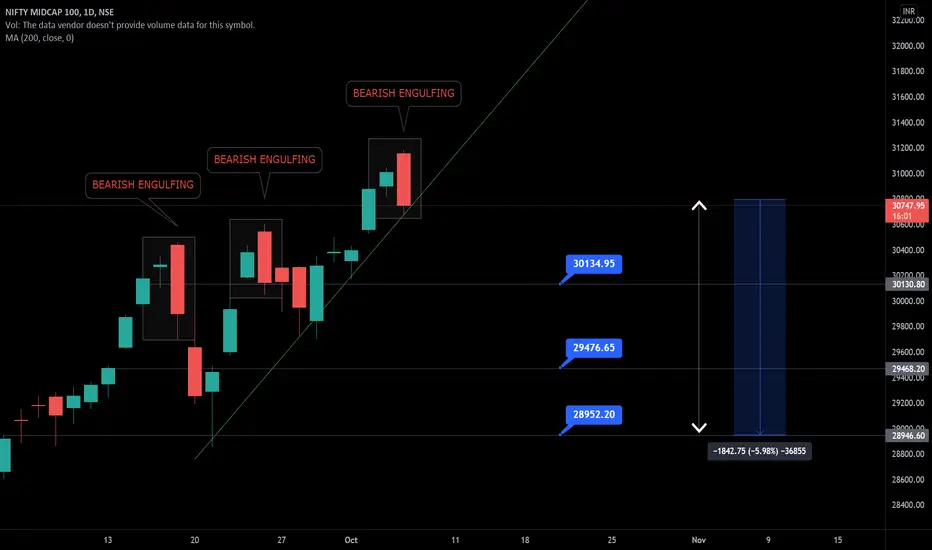
Bearish Engulfing Pattern...For the bearish engulfing pattern, there are 3 criteria:
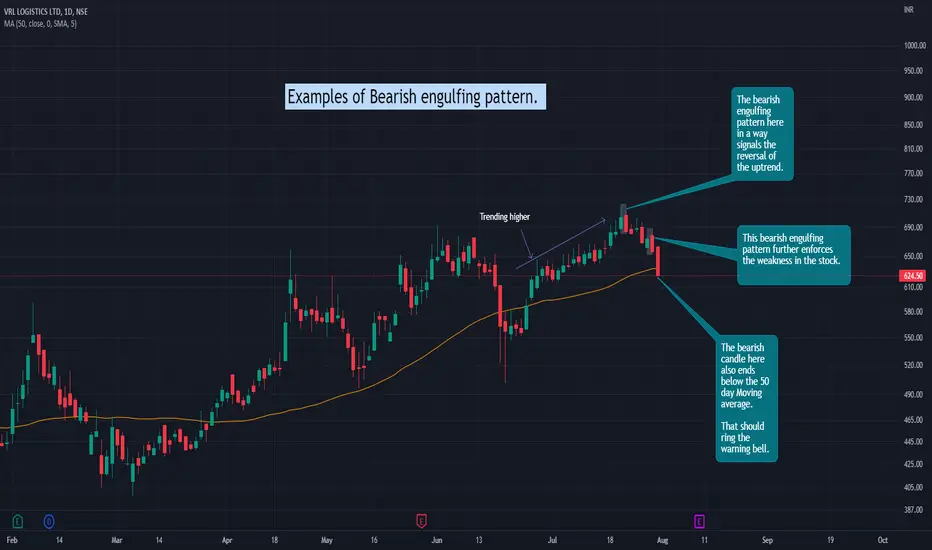
1. Market has to be an in an uptrend. The VRL price was in an uptrend until it reached its high and then the bearish engulfing pattern formed.
2. The second body of the pattern must engulf the prior real body. Here, both the engulfing patterns marked in the chart, display these characteristics.
3. The second body of the pattern must be the opposite color of the first body.
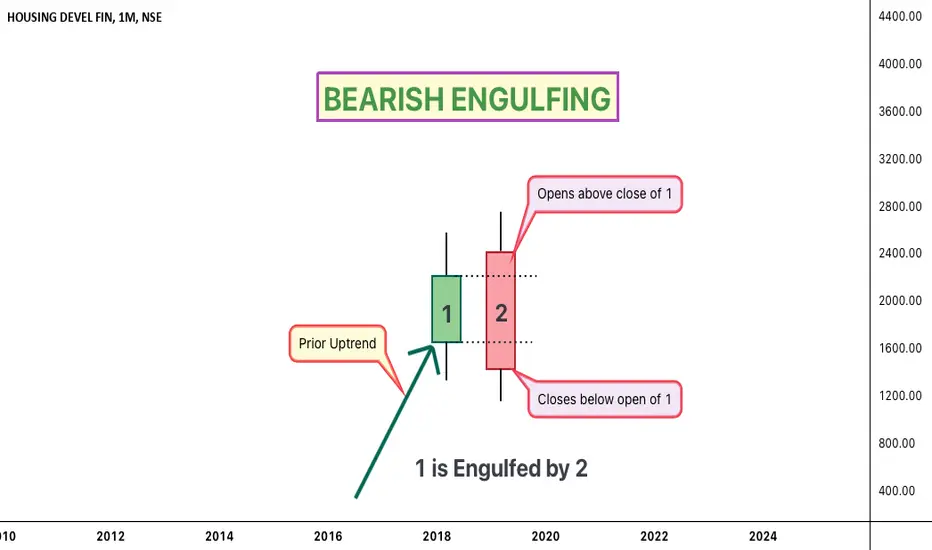
Bearish Engulfing
CANDLE PATTERN 2 - BEARISH ENGULFINGPattern name: Bearish Engulfing
Pattern Type : Bearish Reversal
No. of Candles : 02
How to Identify it ?
1)There must be a preceding Uptrend.
2)A short Green candle followed by a long Red candle.
3)The Red candle should opens higher & closes lower than the Green candle.
4)The Green candle should be completely engulfed by the Red candle.
Psychology behind it :
1)The Bulls lose momentum & the Bears take charge and managed to close below the Green candle.
2)It implies the bears hav
Strong Bearish Reversal Candlestick PatternPattern: Bearish Reversal
1) There must be a prior uptrend.
2) Price opens above previous day close/high and makes a high higher than previous day.
3) The Red candle closes below previous day open/low
Trading this pattern
1) Look for this pattern after a big upmove.
2) Upon confirmation, open a short position on 3rd candle.
3) Place a stoploss above the high of the big red candle.
sell ADANI WILLMAR LIMITED.According to the daily chart there is a clear formation of Bearish Engulfing Pattern , which is further confirmed by RSI levels , and also Stochastic RSI with proper demarcation of overbought scenario in Adani Wilmar Ltd.
All the investors who chased the stock all the way to top , must be aware of the bear trap that had been laid . Sincere advice to all investors or traders having AWL , must consider putting sl in system and trail .
ACC RSI DIVEREGENCE with Bearish Englul WEEKLYStock Name = ACC
ACC has formed Weekly Bearish engulf Pattern which indicates Reversal from the top.
Bearish Engulf can be confirmed by Weekly Bearish Divergence.
Clear short has been formed technically indicates sell.
Important Support and Resistance has been drawn in the Graph.
AMARAJABAT - Hammer formed but also bearish engulfingAMARAJABAT although one of the leading battery company and a big boost for EV industry is downtrending for long time, it is now its 52 weeks low and is expected to bounce back.
however the good news and bad news is hammer is formed and last day candle is bearish engulfing, that could means either the price will move at full speed or it will move to the bottom support of 600 and form a double bottom with new support.
FSB
A
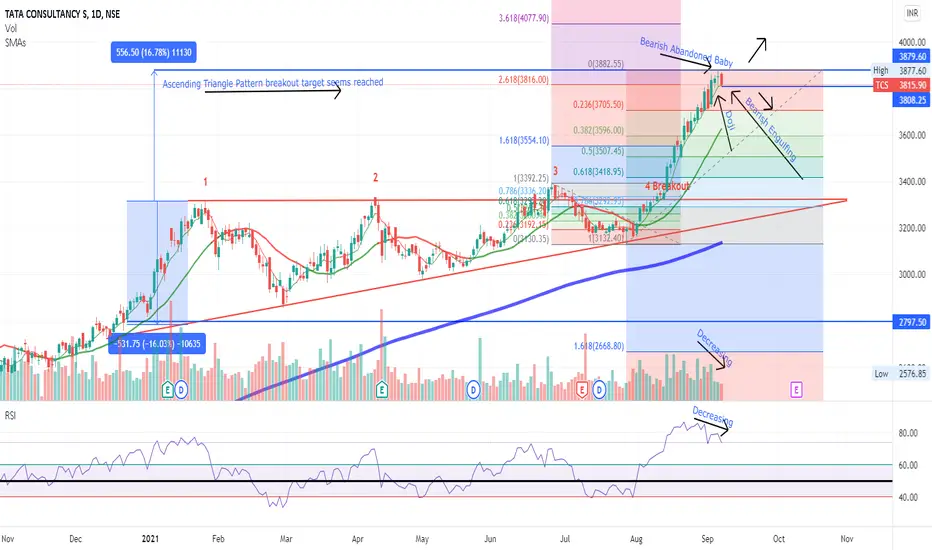
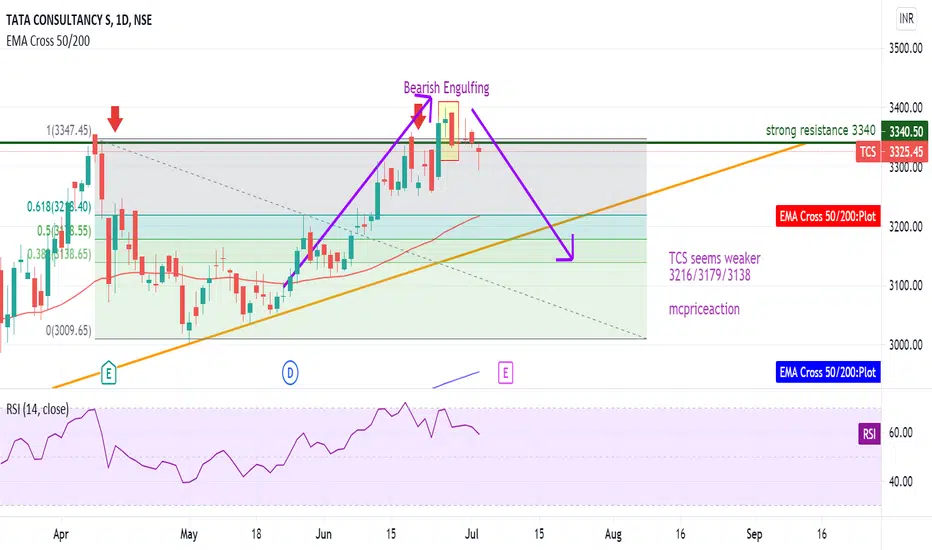
TCS is showing signs of bearishness TCS is showing signs of bearishness..
Reasons/Traits :
• Ascending triangle pattern breakout seems reached the target (For this pattern targets usually will be the width of current triangle pattern as shown ~16%)
• Daily Trend far away from 200 EMA
• Uptrend is in pause mode
• Bearish Abandoned Baby pattern (last 3 candles) formation seen (very rarely this kind of pattern is seen indicating chances of downtrend)
• Doji is formed at the top of the uptrend (Trend uncertainty)
• Bearish Engulfing
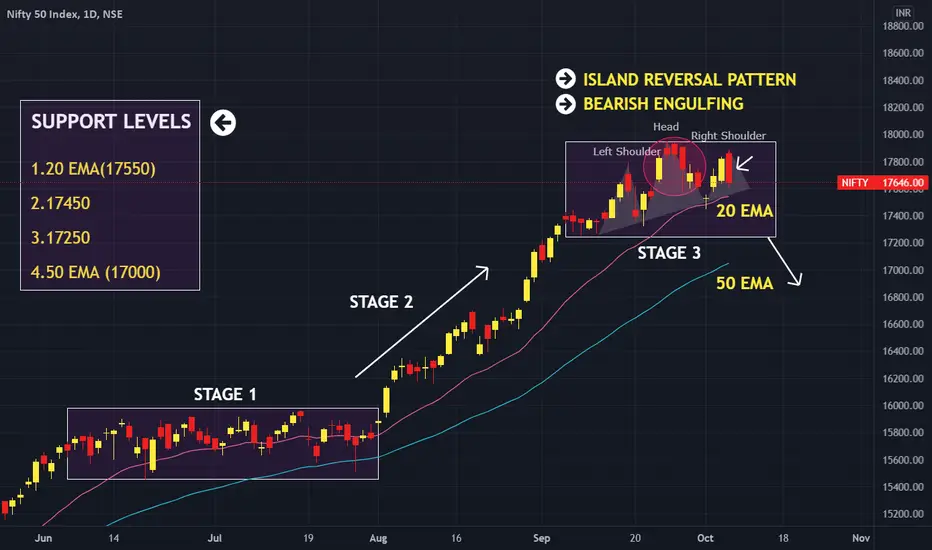
MULTIPLE REVERSAL PATTERNS IN NIFTY 50LONG TERM BULLISH STRUCTURE OF NIFTY 50 IS INTACT.
In Short Term we might see some pullback due to 2 reversal patterns and also formation of head and shoulders
Support levels have been discussed in the chart.
Reasons for pullback
1.Weak global cues
2.Rising crude prices
3.Bearish engulfing pattern
4.Island reversal pattern
5.Formation of H&S
6.Multiple rejections from 17800 levels
FOLLOW me for more such content ahead.Do hit the like button if you gained something from the post
Till then,
HAPPY
Bearish Engulfing TCS A bearish engulfing pattern is a technical chart pattern that signals lower prices to come. The pattern consists of an up (white or green) candlestick followed by a large down (black or red) candlestick that eclipses or "engulfs" the smaller up candle.
Bearish Engulfing Potential Sell Signal:
Three ways for selling using the Bearish Engulfing Pattern from most aggressive to most conservative:
1. A Aggressive trader might sell at the close of candle
2. If there is a substantial increase in
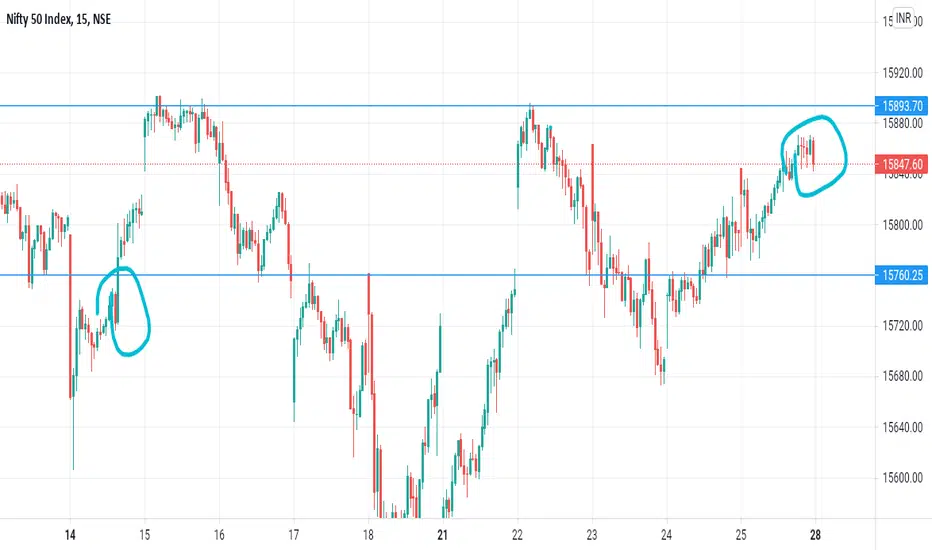
#Nifty Trade Setup For Monday (28th June)There is a three scenario in Nifty.
.
1. If Nifty give the gap up opening above 15900 then it goes down till 15760.
.
2. If Nifty gives gap down Opening so 14760 will be the strong resistance from down to upside.
.
3. If Nifty give normal opening then market should go down according to last bearish engulfing candle.
.
So what's your view. Comment below
AMARA RAJA BATTERI @ Make or Break & Trend Based Fib ExtensionAMARA RAJA BATTERI @ Make or Break & Trend Based Fib Extension
Negative:
BEARISH ENGLUFING PATTERN formed in 4hr Candle /Daily candle , If immediate support fails downtrend may be seen with next support 712 followed by 723.
Positive:
766 is immediate support and Board meeting - Results on 22 May 2021,
Upper side Targets : 826 ,863, 892, 922
Note: This analysis is only for educational purpose.
A
SENSEX SHORTSo here is an analysis of another index 'SENSEX'. Let us understand price action of SENSEX in detail! (OPEN THE CHART FOR BETTER UNDERSTANDING)
Firstly, if you have a look at the second last (green) candle here, it is clear that this candle was not able to sustain above a major resistance line (yellow line).
Secondly, today the price shot up the major resistance line, but experienced selling pressure near its all time high (ATH) and wasn't able to sustain above the major resistance line. We ca
TITAN Big Bull favourite I'm expecting a breakdown (maybe the stock can take support at the level and possible for a double bottom and move upwards)
The Reason Why I'm bearish:
1.Bearish Engulfing at channel resistance
2.Global crisis
3.Nifty looking weak
4.Rangebound breakout will be very effective.
5.Avoid taking long for this month(index looking weak )
Disclaimer: Please consult your financial advisor,
Investment/Trading in the securities market is subject to market risk, We are not responsible for your profit o
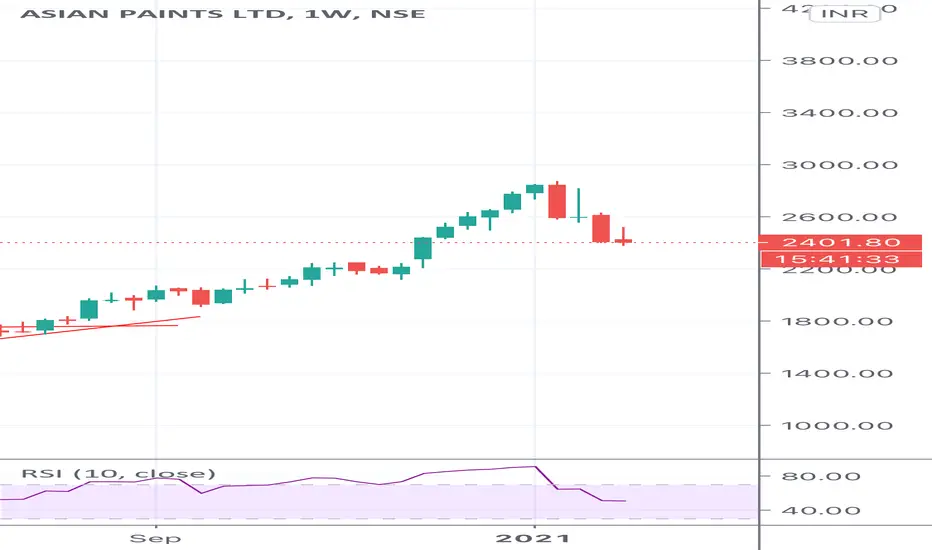
Short Asian PaintThere’s a huge price rejection by bears at the top levels - look at the candles showing bearish engulfing the green candles in the charts.
Tgt - 100-200 points
SL - 200 points
You may also enter PE position of 2400-2300 or Short CE above 2500
Would like to know your views too. Pls comment.
A Perfect example of "Bearish Engulfing" (Dixon)Dixon has seen a massive uptrend and also in the upper band of RSi (80) and also formed bearish engulfing, so in short term, we can see a good correction.
What is bearish engulfing?
- A is a technical chart pattern that signals lower prices to come. The pattern consists of an up (white or green) candlestick followed by a large down (black or red) candlestick that eclipses or "engulfs" the smaller up candle.
This analysis is done only for educational & intelligence purposes, invest or trade
EURUSD, Weekly analysis, Oct 19-23Euro against Dollar pair, is looking bearish in the 3rd week of October, When you see the monthly chart, bearish Engulfing September month candle still expect to send the price down , in short term view, we can expect the price go down till 1.16 area this week
Note - Price action analysis for education purpose only
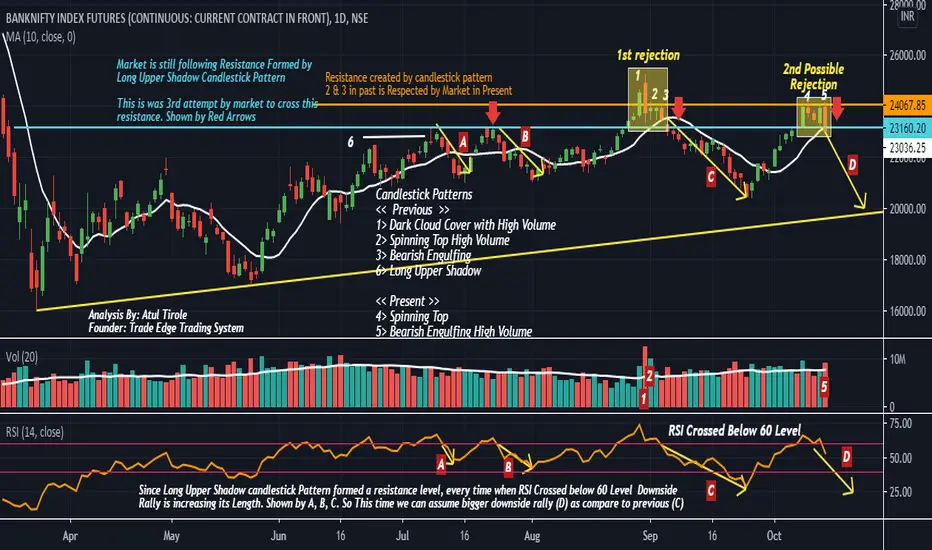
Bank Nifty Is Now Ready For Fresh Downside RallyThere are many Price Action Patterns indicating that Bank Nifty can start fresh downside rally.
For More details: Follow above analysis
BShort