BANKNIFTY POTENTIAL MAJOR LEVEL BREAKIn the next few days, BANKNIFTY can potentially break the major level of 23000. The stock can go in a bearish trend if BANKNIFTY can break the level. As seen in the chart, 23000 was a major resistance level. But BANKNIFTY was able to break that level. Now 23000 is a major support level for the same.
INDICATIONS:
1) The stock price has crossed EMA200 and went below the level.
2) The stock has formed a BEARISH ENGULFING pattern.
3) The stock is about to break the major level of 23000.
For Be
Bearish Engulfing
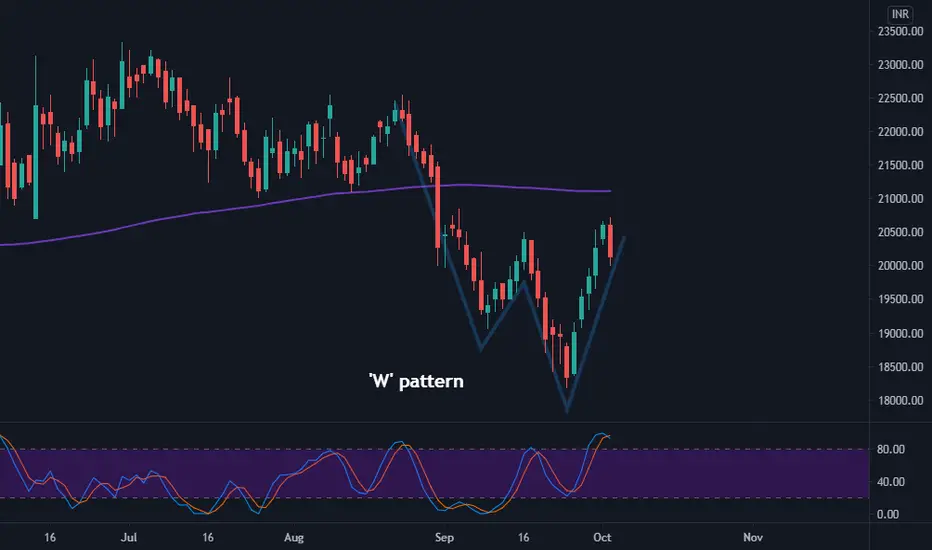
Failing W pattern in Shree CementShree Cement is on a clear downtrend. But the W pattern would make one think that downtrend has come to an end as it is a bullish reversal pattern seen at the end of a downtrend.
Here's why I'm short:
1) Bearish engulfing candle. (right at important level where if it crosses above, would make one to take a long position)
2) Bearish engulfing candle after a nice bull run.
3) Stochastic RSI overbought.
Target: 18000 SL: 20720
I've also given a screenshot of Shreecement in a lower time frame
JShort
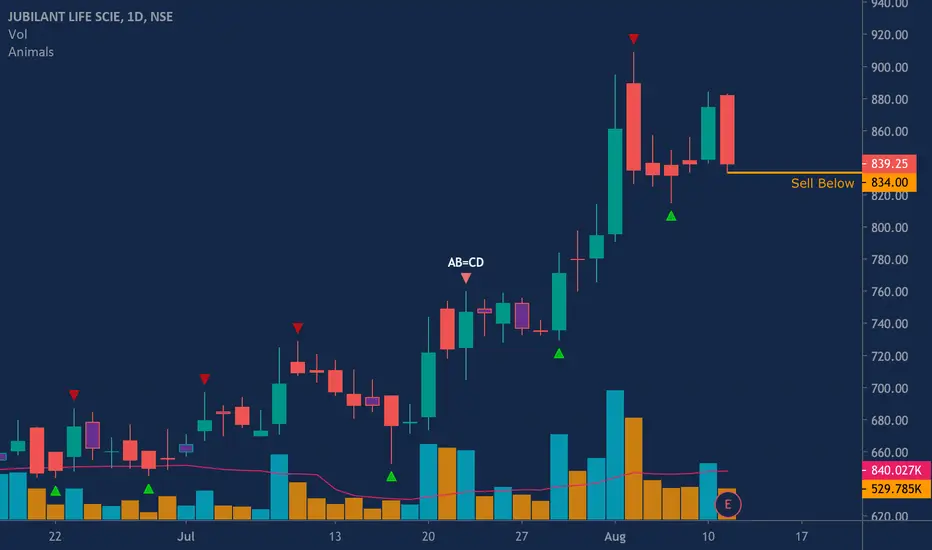
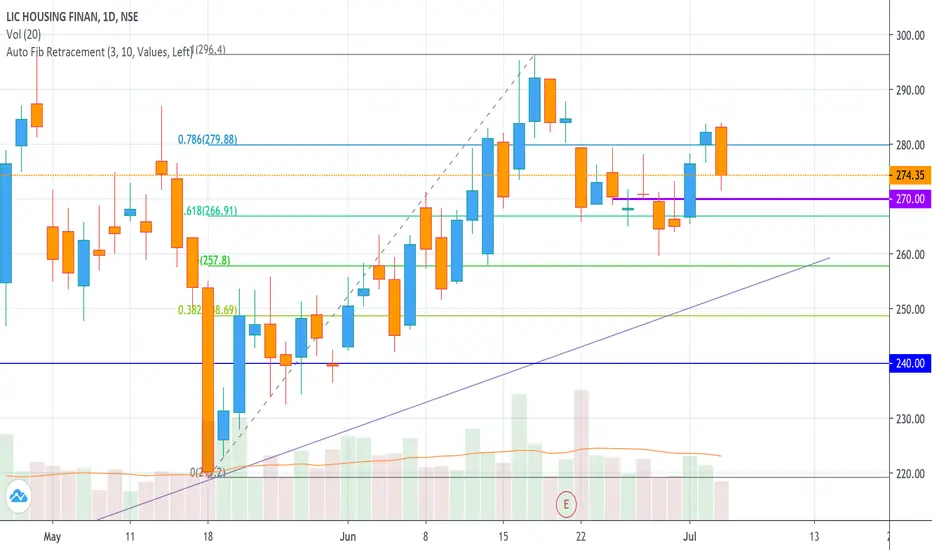
LICHGFN - Bearish Engulfing + Fib RetracementThe stock made bearish engulfing pattern from the 0.786 levels and seems bearish to retrace to the stronger 0.618 level of 265.
Choose an entry position based on your risk appetite.
Strategy 1: 'High-er' Risk & High RRR
In-case of normal or gap-up opening, Short for 270, 267, & 265 with SL at 278.
(Can wait for any small uptrend with the risk of losing out on opening downfall)
Strategy 2: 'Less' Risky & Low RRR
Short below 270 for 267 & 265 with SL at 274
In case of gap-down opening - Wait a
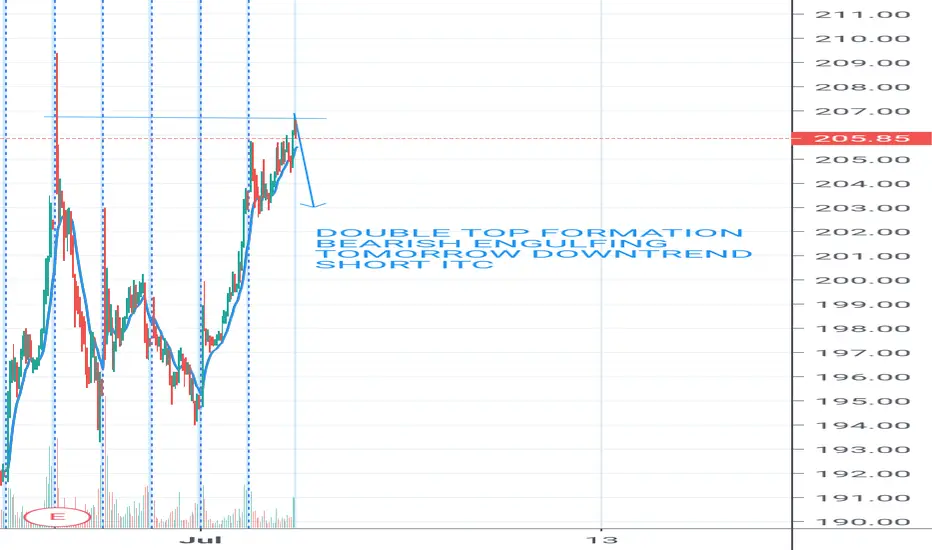
Double top formation is seen in ITC. Short ITCDouble Top formation is Seen in ITC.
Closed with a Bearish Engulfing pattern.
According to me ITC will go Down today.
Short ITC, might be the best trade option for today.
It's just my personal analysis so do your own and I don't recommend anybody to Short It as it is just my analysis.
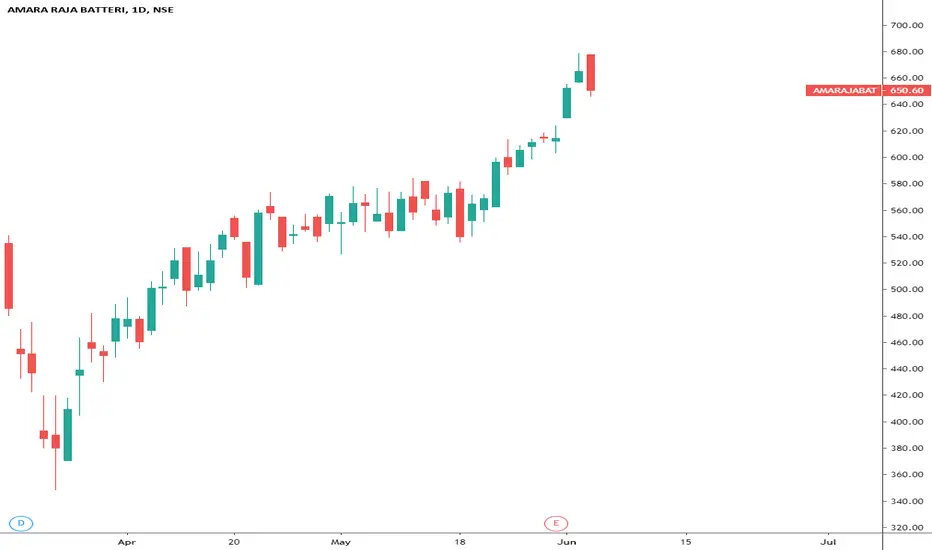
AMARARAJA BATTERIES BEARISH ENGULFING SHORT@653-658
STOP@671
TARGET-1@635
TARGET-2@620
!!please note trade with caution!!
!!manage your risk!!
!!trade-wise!!
!!please adjust for future rates!!
AShort
Updated: Upside gap two crows followed by shooting star
This is an updated chart of NIFTY 50 (with reference to my previous chart)
Upside gap two crows
16 April 2020: It was a bullish candle. (Continuing the bull trend)
17 April 2020: Gap up opening but ended the day with a bearish hanging man pattern.
20 April 2020: Opening was at 9390, i.e more than closing of day 2. It made a bearish engulfing pattern.
22 April & 23 April 2020: Gap was filled (I referred it as retracement in my previous post)
24 April 2020: Shooting star patte
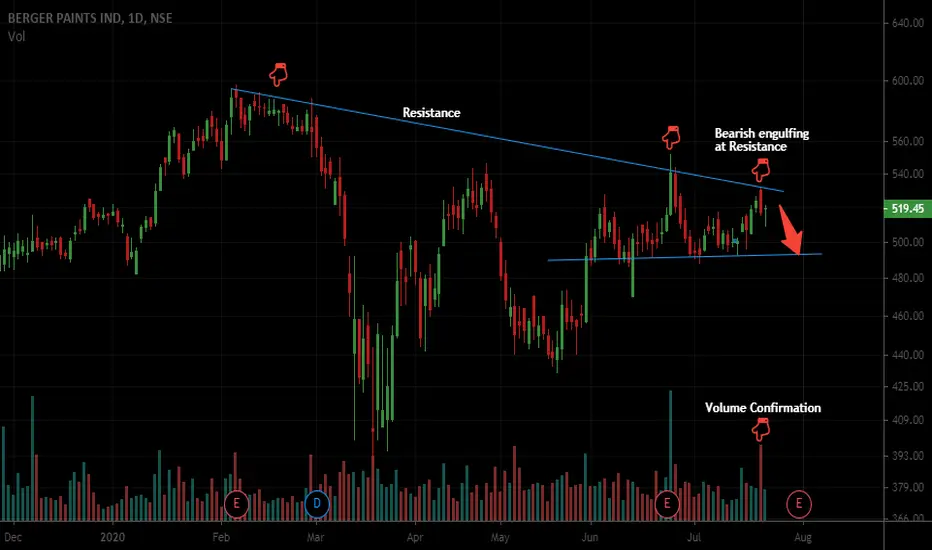
Cadila Healthcare (4 hrly chart)1. Taking Resistance at trendline.
2. Bearish engulfing Chart pattern.
3. Negative divergence on MACD
CShort
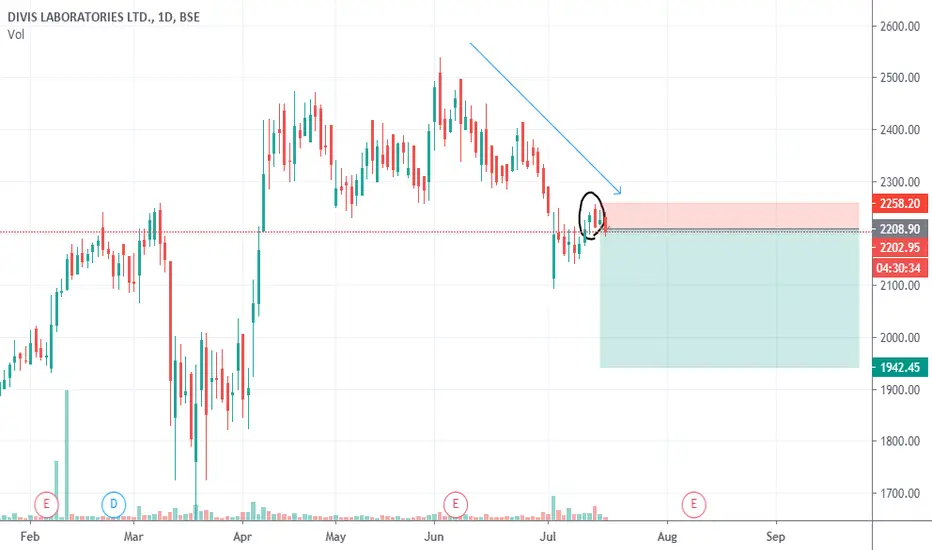
SHORT TRADE IN HDFC !!(DEC FUT)!!SHORT TRADE IN HDFC !!(DEC FUT)!!
VIEW
-BEARISH ENGULFING ON DAILY CHART
-RSI REVERSAL (-VE)
TRADE VIEW
DEC FUT
SHORT@2325
STOP@2290
TARGET@2355
LOT:250
QTY:2
HShort
Manappuram short nov2019Ok so this rectangle size box is only hope for this stock to continue this upside momentum, I will look to short below this box and this looks good for 8-10% downside move. Actually I was long in this and just got a good exit today now suddenly it is looking good for downside too and I thought why not. Let’s see..
And guys please do your own study before any trade, I do this to record my trades only..