Bearish Engulfing
Bearish signs on EUR/USDHello everyone. Here we have the EUR/USD daily chart. The trend here is still bullish, but we have to keep in mind that the trends of higher time frames are bearish, and we also have a few bearish signs on the daily chart. First, as you can see, the price tried to climb higher, but after that we could see the W&R pattern and the downward action started. Also, the whole situation is not in favor of the EUR at all. There are many worrying factors that pose a big risk to the EUR and with that in mi
ATOM SCALPING Atom seems to hit a strong support, while it has broken the Bearish trend line, I think the candlestick pattern( something like an imperfect bearish engulfing) form at the level of a dynamic resistance would lead the price to the support 25.67 to 25.38 USDT for the last time and after formation of a key level we could see growth to 27.49 to 27.67 resistance. also Follow line Indicator along with Hull moving average Band show some signs and signals of change in Trend, so after formation of fist
GOOG: Time to buy the DIP? Complete analysis (H,D and W charts).Hello traders and investors! Let’s see how GOOG is doing today!
First, we see a good reaction today, in the 1h chart, as the support area between the two black lines at $ 2,667 - $ 2,651 is holding the price nicely.
Right now is a good time for a bullish reaction, and GOOG could fill the last gap at $ 2,747.65. However, in order to reverse, we must see a stronger bullish structure, because the trend is still bearish. We see nothing but lower highs/lows, and the 21 ema is descending as well.
T
IBKR share reversal pattren spotted.Hello dear fellow traders !
Today i spotted a reversal bearish engulfing pattren in interactive broker stock, as we can see in chart that after a minor uptrend prices has reversed and form a candle which looks like sellers are totally in control and share can continue towards down trend and we can get 3% to 4% in profit's.
Thank you.....
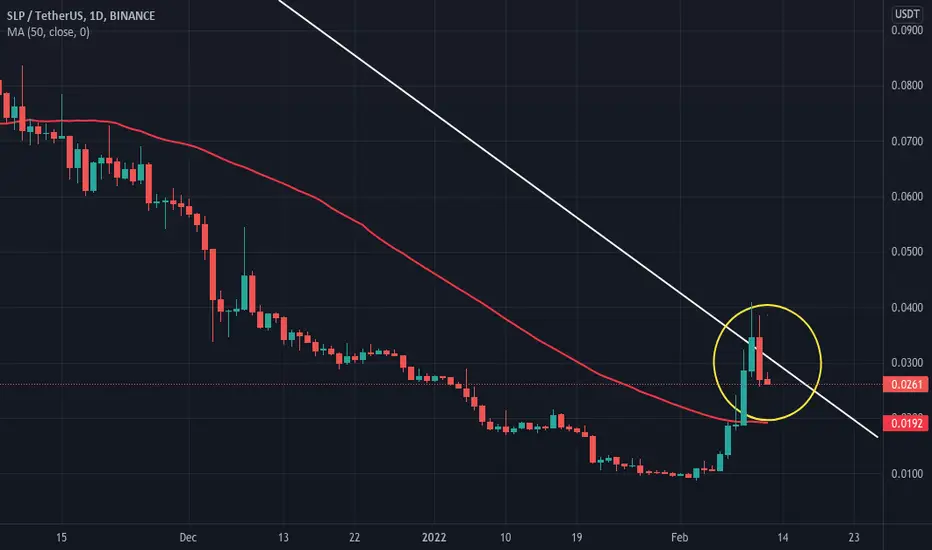
SLP-USDT UpdateIt seems like SLPUSDT had a false breakout and the resistance line is still intact. It is probably in a correction phase after a great run up.
There is a battle going on in the circled area.
A bearish engulfing pattern is present on the daily so can expect more downside action possibly to the 50DMA unless trendline is successfully broken with the retest of the line.
* Not financial advice. Please do your own DD.
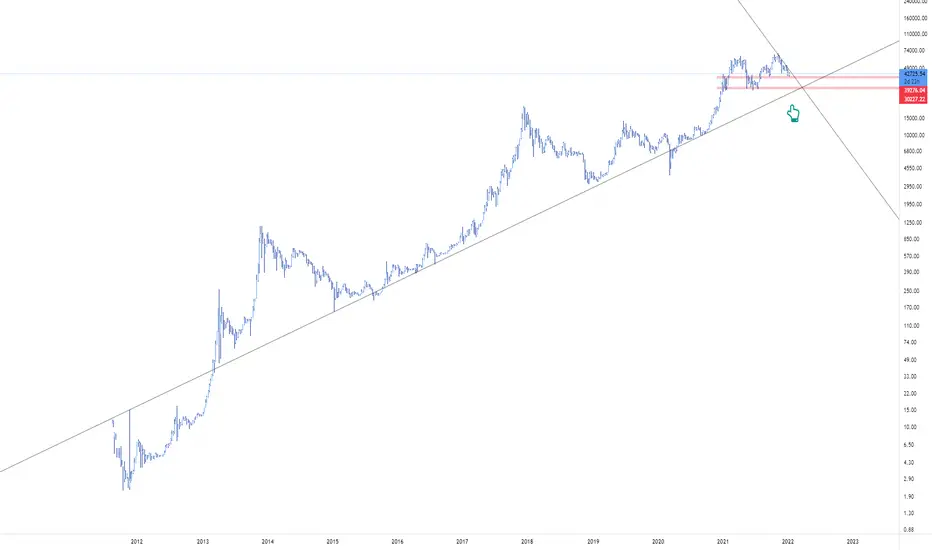
$SPY Bearish Engulfing on the monthly $SPY Bearish Engulfing on the monthly
There you have it. January closed with one of the most reliable indicator of trend reversal - the bearish engulfing candle - on the monthly chart.
——————
I am not your financial advisor, but I will happily answer questions and analyze to the best of my ability but ultimately the risk is on you. Check out my ideas, but also do your own due diligence.
I have a huge tolerance for volatility so please know that. If you’re new to my trade setups p
Tech Sector Setting Up for Big Monthly Bearish PullbackWe have a Bearish Engulfing on the Monthly along side with extreme amounts of RSI Bearish Divergence and soon the MACD will be crossing bearishly for the first time since 2018. In the past the monthly bearish crossing has lead to at least a 30% correction back down to the 55 Month SMA.
One last thing to note is that if this Monthly Candle continues down a little further and closes below the open of October 2021, this pattern will be upgraded from just a simple Bearish Engulfing to being a Bulli
A clear short for AJAUDJPY has been in a clear bearish trend for a while now.
With that momentum in mind, we can see a nice double-top at the support on 82.466. We can also see a rejection off of the trendline and a nice bearish engulfing for price action.
This trade should run 65 pips to the next support on 81.658.
Good luck this week traders!
AAPL - Sign and ConfirmationThe long upper wick of the candle is a sign of price rejection.
The first bearish pin bar on November 22, followed by another higher high long upper wick candle on December 1, is a sign that the trend is about to bend. Confirming the two sign is followed by another higher high with Bearish Engulfing Candle, this candle pattern could be the confirmation that the upward trend is done.
And also, if you draw a line, you can see that there is a Bearish Broadening Wedge forming.
Apple – Why the bearish engulfing not so bearish NASDAQ:AAPL
Observations:
After breaking the upward channel, Apple is at re-test point on upward band of the channel. (shown at B)
It closed at the 76.4% Fibonacci level from the lows of Oct 2021. (Shown at A)
Though the bearish engulfing is formed, the weakness can be only confirmed once upward channel is decisively broken on downside. The level is also near to 38.2% level at around 155.
SHORT ON GOLD - SUPPLY & DEMANDGOLD is currently at a key supply zone, marked out on the 30M timeframe. Previously, GOLD has rejected this zone with strong momentum, and we can already see strong selling pressure at this zone.
We've just seen a huge bearish engulfing candle formed the 30M timeframe, creating a new lower low. I am now looking for GOLD to come up to supply once more to complete the head & shoulder pattern making that lower high which so happens to line up with the 61.8 Fibonacci level.
I personally believe
WMT shortEntry price: 150-152$
Target price: 135-137$
Stop loss: 153-155$
Chart pattern: double top - the price formed the second top, thus the price reversal is very likely
Candlestick pattern: bearish engulfing
RSI: approaching 70 level, therefore, the price is almost overbought
Conclusions: the chart pattern, candlestick pattern and RSI suggest the trend reversal in the near future. Thus, the short position is recommended with the stop loss above the resistance level.
No financial advice
WShort
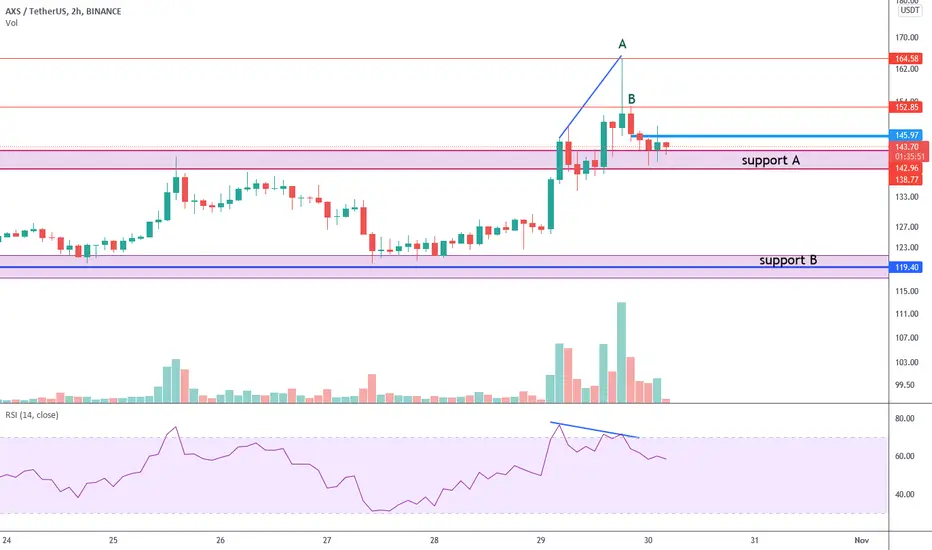
AXSUSDT | short opportunityOn the 1-hour timeframe, we see the bearish divergence formation.
On the 2-hour timeframe, we see a confirmed reversal pattern represented by a shooting star candle "A" with a bearish engulfing candle "B" confirmation.
4-hour timeframe, also represented by shooting star.
We can expect a downward movement with a take-profit target near the "B" support area of $120, but we still need to break through the "A" support area near $140.
BTCUSD - H4/H1 - MAGICAL CLOUDS !H4 :
Once again the clouds acted perfectly well on both sid e, in rejecting, respectively
a downside breakout attempt around 60'000 and more recently an upside breakout
around 63'600.
In addition, price action on the top of the clouds, triggered a "BEARISH ENGULFING"
pattern.
Ongoing downtrend channel still in place and clouds area should be seen as a barometer
for further development.
Indeed, IMPLICATIONS a clear breakout of :
1) UPSIDE : 63'000/63'500 (former congestion top) woul
TXN shortEntry price: 199-201$
Target price: 186-189$
Bollinger bands: the price approached the upper boundary
RSI: bearish regular divergence, therefore, the price retracement is likely to occur
Stochastic: the asset is overbought
Candle pattern: bearish engulfing
Conclusions: All indicators suggest trend reversal in the near future. Thus, the short position is recommended.
No financial advice
NZDCHF - (D) IN TREND BEARISH ENGULFING SETUPNZDCHF has formed a significant bearish engulfing on the daily time frame
Entry at the 50% retracement level has been perfectly rejected 3 times.
The bearish engulfing candle engulfed 5 previous candles.
The daily time frame bearish engulfing candle closed Wednesday.
SL set above engulfing candle high. TP set at 3X risk.
USDJPY Idea 9/30/2021Hello traders, this is an idea for USDJPY. Nice double top on the 4 hour time frame. Two possible scenarios.
1. Price could retest and go long to form a nice head and shoulders and then retest neckline (111.200) and go short from there.
2. Price can breakthrough 111.200 and retest 111.000 and then go short from there.
If you agree, give this chart a like and follow for more
Trade responsibly.