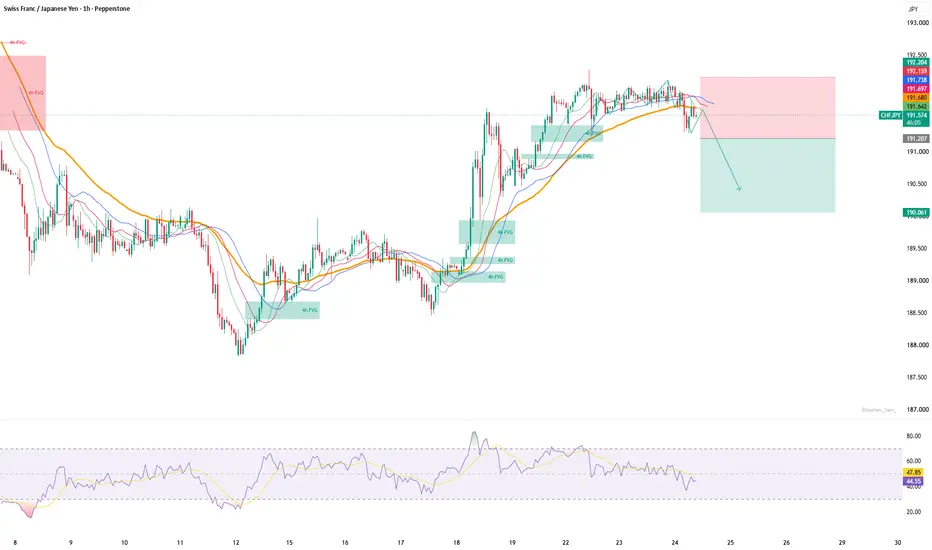
Time to Sell CHFJPYSwiss frank was franking for about 2 days moving inside the hourly zone.
On 1H timeframe it created bearish diveregence following a big bearish move and then consolidation between the hourly zone.
Bearish Score
CHFJPY trading below the William Alligator. The Alligator mouth is open downside.
Price is trading below 50 EMA on hourly time frame
On Daily Time frame the trend is Bearish.
Bullish Score
Hourly trend is still Bullish unless it not breakdown below 191.18
If the price
Bill Williams Indicators
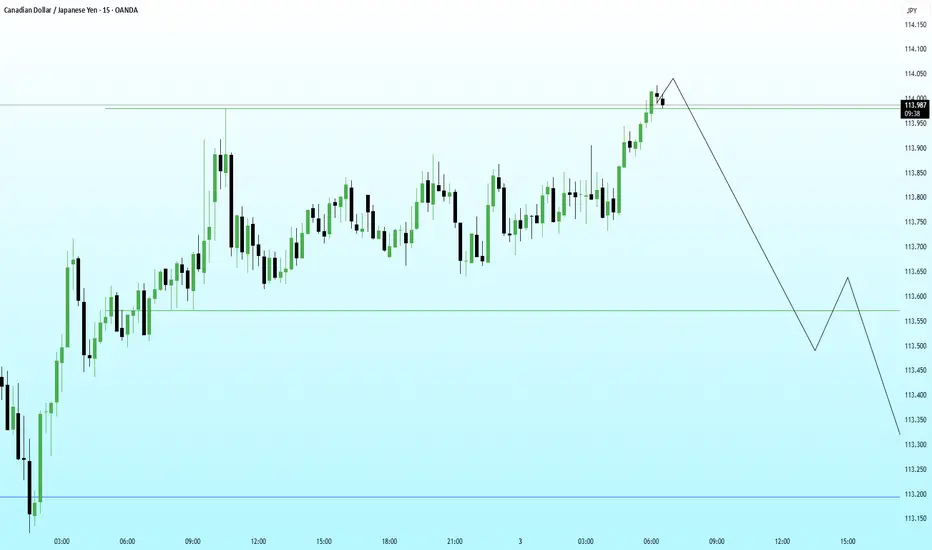
CAD/JPY โ 15 Min CADJPY is currently auctioning into a well-defined premium array, approaching clustered buy-side liquidity resting just beneath the 114.00 psychological handle. The recent impulsive expansion exhibits the characteristics of a liquidity engineering move, suggesting the objective may be stop collection rather than authentic bullish continuation.
Price is interacting with a refined bearish order block, aligned with the upper boundary of the active dealing range. The lack of efficient acceptance be
XAUUSD (15M) โ Liquidity Sweep โ Distribution SetupPrice is currently trading inside a clearly defined range.
Previous sell-side liquidity has already been swept from the equal lows, triggering a sharp displacement to the upside. This move looks corrective rather than impulsive.
Key observations:
Upside move is targeting equal highs / range high liquidity.
Area near the range high aligns with premium zone + likely supply.
Expecting buy-side liquidity grab above highs to trap late longs.
Plan & Bias:
Allow price to run the highs and com
GBPUSD ยท 15M ยท SMC OutlookPrice is trading deep into premium, pressing against a well-defined HTF supply zone.
HTF Framework
Clear bullish leg already completed.
Buy-side liquidity resting above recent highs.
Premium zone aligns with prior distribution and weak highs.
LTF Structure
Momentum is slowing near the highs.
Price is consolidating under resistance, hinting at distribution.
Minor pullbacks are being absorbed, classic liquidity buildup behavior.
Expectation
A final push higher to sweep buy-side liquidity
XAGUSD โ Clean Rejection From Discount Zone With Upside Silver reacted perfectly from a refined discount zone after a controlled pullback. The immediate rejection and push back above micro structure levels indicate bullish absorption and renewed momentum.
This reaction aligns with the broader HTF bullish narrative, suggesting price may continue expanding toward upside inefficiencies if structure holds.
Bullish Path:
โข Tap into refined discount zone
โข Strong rejection wick + recovery
โข LTF structure shift confirming accumulation
โข Expansion toward n
US500 โ Liquidity Sweep at the Highs With Bearish Continuation PPrice has swept the immediate buy-side liquidity sitting above the recent high and is already showing signs of exhaustion. The reaction suggests a possible distribution phase forming near the top, aligning with the broader HTF narrative for a corrective leg.
If price fails to reclaim the swept high, the next logical target becomes the sell-side liquidity resting at the lower blue line.
Bearish Path:
โข Sweep of the highs
โข Failure to sustain above the level
โข LTF shift into bearish structure
โข
Tata Communication: Long Setup
Showing two charts side-by-side - both 1H.
Left side: A clear Darvas Box breakout with good volume (more than average) and RSI is upticking above 60.
Right side: Alligator is wake up. The price line cut through the alligator. Lips - Teeth and Jaws are perfectly placed for an upmove.
SL: 1380. T can be 1430.
Alternatively 1400 Jan-25 CE at 30 with 20 as SL.
TLong
GNFC LongThe stock looks good for a long entry due to following reasons
1) Stock is at a demand zone from which we have seen significant rally
2) Though the stock is forming new lows in smaller time frame, the stock has reached an important support level
3) We are also seeing Awesome Oscillator divergence in the chart
We may see strong reversal upto the Supply zone as marked on the chart.
Disclaimer: Only for educational purpose.
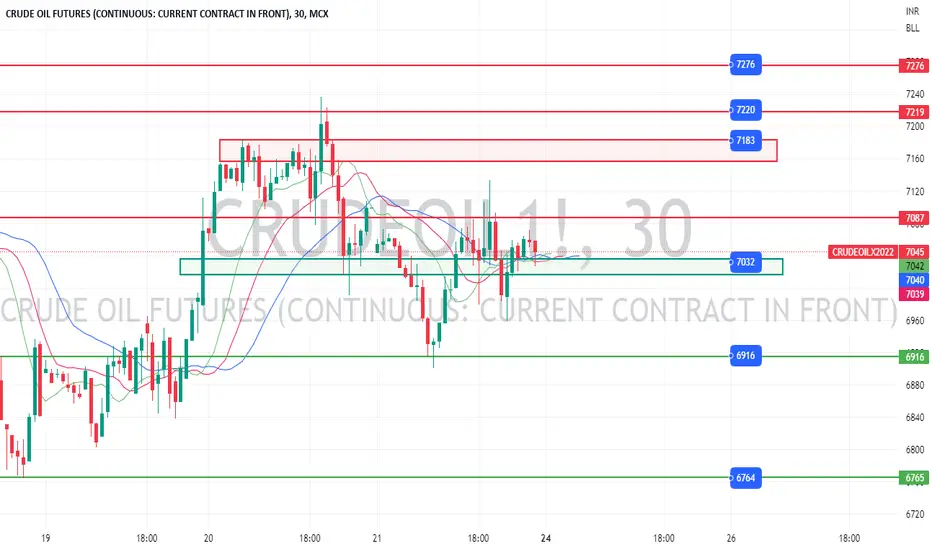
Crude Oil (MCX): Monday - 24/10/22This is done using the multi-timeframe, multi-period technique we were discussing last Fridayโs call.
Chart:
Analysis:
Levels:
Support: 7000, 6900, 6750
Resistance: 7080, 7150, 7220
OI Data:
Highest OI Call in Crude per OI data: 7500
Highest OI Put in Crude per IO data: 6500
Nearest Major Resistance in Crude per OI data: 7200
Nearest Major Support in Crude per IO data: 7000/6900
Trade setup:
1. Today MCX is open in the evening slot (5:00 PM to 11:30 PM)
2. Upto Daily timeframe Crude i
NATIONAL ALUMINIUM : Strong BuyNSE:NATIONALUM shows strong buy indicated by PSAR, MACD & Fisher crossover followed by EMA & MA Crossover
Target 1: 128.40
Target 2: 132.75
Stop Loss: 122.70
๐ซ๐๐๐๐๐๐๐๐๐:
The analysis is only for illustration purposes only. Please consult your financial advisor, agent, broker before acting on any information. We may or may not have positions in the stock and our actions may be contrary to the one mentioned here. This analysis may or may not be updated. We would not be responsible for the prof
Litecoin Will dropLitecoin will drops after 2 days because stochastic RSI shows that litecoin will drop
Go to short
LShort
HDFC Short @2176. TP @ 2146Sell the fractal breakout to the lower side
Price is below the cloud
Chikou-span has exited cloud to the downside
Take profit at 2146. It may take support at this level.
Position sizing is as per risk.
HShort
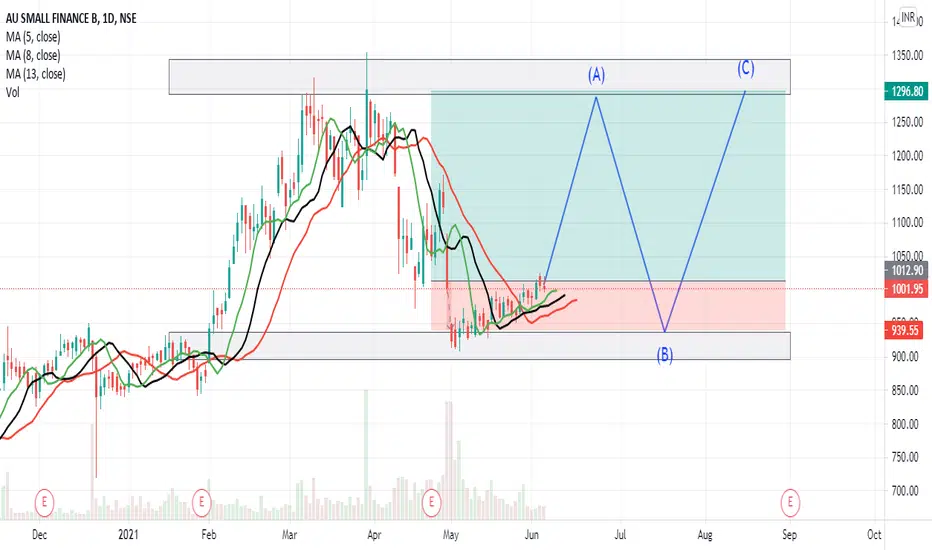
How easy it can be to read Price waves using indicators Well most of you dont know the Wave principle in properly and deep understanding manner , its so easy when you understand the concept
You can look the plotting in the chart , its not candle stick , its not line chart , its not having any Price chart at all , so what i am trying here ??
Its simple people i am using an indicator , Bill Williams indicator called Alligator , You can visually look how the waves have developed in the past and you can easily understand where you are at this i
UShort