Natural Gas is getting ready for 100% move on the upsideNatural Gas has fallen 60-70% from the upside
Now NG is near long term support which is coming around 110-120
One should not miss this opportunity to BUY
Also RSI is also near to its weekly support
It is double confirmation from price wise and also from Indicator wise.
We can expect prices to rise upto 220-240 levels.
YES, That's almost 100% from current prices.
Bill Williams Indicators
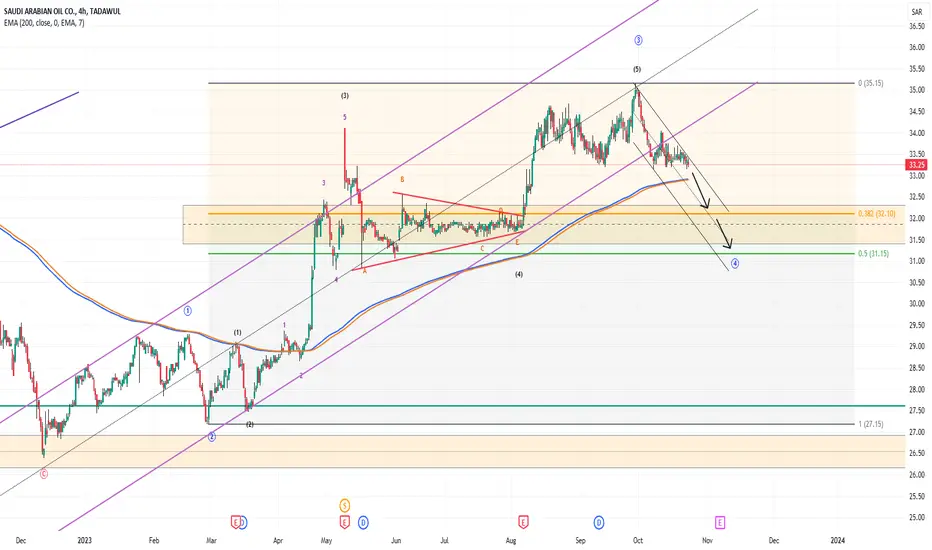
Saudi Aramco Short Term ViewTADAWUL:2222
SAUDI ARAMCO breaks out of parallel channel after completing wave 3 extension.
Now I think it's in wave 4 the ideal correction measure for wave 4 is 38.2% of wave 3. maximum is 50% of wave 3. In this case it's possible that stock will correct to near 50%.
Now why 50% I'm saying is because there is strong support created on 14 jul 2022 at near 31.20 which will act as support.
See my next analysis for LONG TERM view.
OIL | Investment Pick📊 DETAILS
Sector: Oil Exploration and Production
Mkt Cap: 38,539 cr
Oil India Ltd is engaged in exploration, development and production of crude oil and natural gas, transportation of crude oil and production of LPG. It also provides various E&P related services for oil blocks.
TTM PE : 6.56 (High PE)
Sector PE : 7.62
Beta : 0.77
📚 INSIGHTS
Strong Performer
Stock with consistent financial performance, quality management, and strong technical momentum indicating good investo
#NATURALGASNatural Gas started its impulsive wave from 22 june 2020 and complete a 5 wave stucture on 6june 2022.
After that it form a flat correction from june - October and then after form a X wave and now it continues in a zigzag correction whose A & B wave are complete.
Now it in C wave that has same corrector as a impulsive wave .
So go on short on every rise with stoploss of end of 2 nd wave (3.03)
This view is on weekly basis.
XShort
US OIL BULLISH MOMENTUM DETECTEDUS OIL faceing a trendline support on week chat
Hence a good opportunity for all forex and CFD user to grab this one
It will be bullish for more than 1 mongth
Due to week chat analysis
Hence analyse yourself for short-term trade
just buy side only
Market is bullish
So trade only buy side on your trade setup
Oil India Limited - Long Setup, Move is ON...#OIL trading above Resistance of 502
Next Resistance is at 774
Support is at 334
Here are previous charts:
Chart is self explanatory. Levels of breakout, possible up-moves (where stock may find resistances) and support (close below which, setup will be invalidated) are clearly defined.
Disclaimer: This is for demonstration and educational purpose only. This is not buying or selling recommendations. I am not SEBI registered. Please consult your financial advisor before taking any trade
Long bet on NATURAL GAS?Natural Gas is currently trading in a support zone of 170.
It is a long term support zone and CMP is 172.
Long position can be taken at CMP and more can be added around 168-166 levels with Stoploss below 162.
Targets can be 192 & 210.
I'm expecting the gap to be filled which was created some days ago because of panic selling & news flow.
I've created long position in futures. This is my analysis and not buy/sell recommendation.
ASIANPAINTS Breaking out 1 month of consolidation . Reasons To Enter : NSE:ASIANPAINT
1. Stock about to breakout after consolidating for a almost a month .
2. Crude Oil is going down , so considering the inverse correlation between crude oil and paint stocks , we can see demand going up as oil gets cheaper .
3. Stock closing above both 50-9 EMA
4.Breakout , retest already done . Now price might go up .
.
.
.
The information provided is for informational purposes only and does not constitute financial advice. Investing in the stock mark
CRUDE OIL LEVELS FOR UPCOMING SESSION 03-02-2024Lots of News and Up n Down. Will More fall be there in Crude or it will Consolidate here for sometime. We will wait for inventory Data and Any news
RED SEA NEWS and WAR NEWS will have major impact on this....
Till Enjoy weekend and do your study chart and levels is here.. :)
The Tyre King MRF Done with Upside?? Then Downside Levels hereStock is down almost -9% from it's freak trade all time high 150233 dated 17 Jan. 2024
There is only strong resistance around 145800
All other unnamed green horizontal lines could be work as short term support to bounce back and profit booking from short postions.
If Green line broken down decisively then "Support becomes Resistance" theory suppose to be applied.
Disclaimer: Analysis & View are personal and for the educational purposes only. Trade at your own risk. We recommend consult your
CRUDEOil or USOIL . Breakout happened. Target expected is 77/78Symbol : Crudeoil or USoil
Time frame 30 min
Analysis:
Breakout happened on the resistance line with high volume. So we can expect a target of 77/78.
HOPE our analysis is adding value to your Trading Journey.
NOTE: Published Ideas are for ‘’EDUCATIONAL PURPOSE ONLY’’ trade at your own risk.
NOTE: RESPECT The risk. SL should not be more than 2% of the capital.
Available at supportHi.
Kindly read my note in chart.
Thank You.
Crudeoil is Neutral trading at current level, If it will get some crazy volatility then trend may shift to positive or negative.
Moreover we should not ignore any side breakout or breakdown.
Here is less chance to fake out or shake out.
All of mine details are subject to market risk, kindly take some advise on it from your analysists.
IOC - Add to WatchlistIndian Oil Corporation Limited is engaged in refining business. The Company's segments include Sale of Petroleum Products, Sale of Petrochemicals and Other businesses.
TTM EPS: 17.36
TTM PE: 5.43
P/B: 1.00
Mkt Cap (Rs. Cr.): 133,022
Dividend Yield: 3.19
Sector PE: 30.01
Book Value Per Share: 94.73
Some Positives:
Strong Momentum: Price above short, medium and long term moving averages
Growth in Net Profit with increasing Profit Margin (QoQ)
Increasing profits every quarter for the past