Nifty 1D: Breakaway Gap Meets Overextended ResistanceOverview 📊
Following a sharp structural decline, the Nifty 50 (1D chart) has printed a classic bullish trend reversal pattern, punctuated by an aggressive surge in short-term buying momentum. 🚀 While the structural breakout remains highly valid, a confluence of immediate overhead resistance suggests the index can ripe for a healthy mean-reversion pause or profit-booking phase 🛑 before continuing its upward trajectory.
Technical Breakdown 🔍
1. Reversal Structure & The Breakaway Gap 📈
• Double
Breadth Indicators
Nifty - The Strong Reboot?When everyone one in the room is bearish by the moves Nifty showed this last 2 weeks, I am bold enough to say the worst may be Over!
1. War probably may not continue or will have a negotiations. May be Rulers like war but people love peace.
2. Trump's Tantrums started having some pushback in no war participation by many countries.
3. How agenda of Oil business & Dollar seems to be in sight.
4. US Market ready & pressures for upside, he has already set the ground for a Big move with next
Gold Breaks the Accumulation Base as Selling Pressure Extends
Gold has shifted back into a clear bearish structure after breaking below the recent consolidation zone, confirming that the market is no longer in a holding phase but in a continuation move lower.
The macro backdrop is also adding pressure. Escalation in the Iran conflict has pushed oil prices sharply higher, with Brent moving above $100/barrel amid disruptions tied to the Strait of Hormuz and attacks on regional energy infrastructure. That has increased market stress and volatility across a
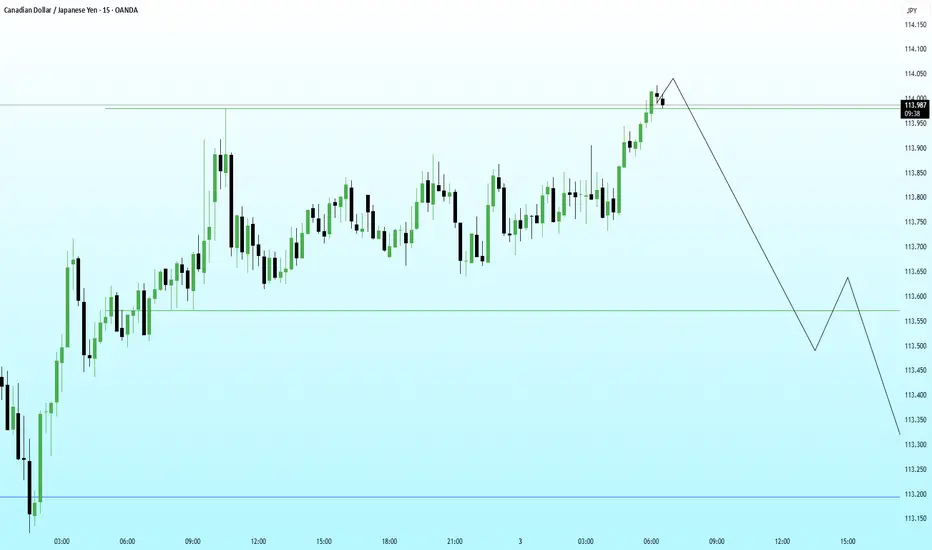
CAD/JPY – 15 Min CADJPY is currently auctioning into a well-defined premium array, approaching clustered buy-side liquidity resting just beneath the 114.00 psychological handle. The recent impulsive expansion exhibits the characteristics of a liquidity engineering move, suggesting the objective may be stop collection rather than authentic bullish continuation.
Price is interacting with a refined bearish order block, aligned with the upper boundary of the active dealing range. The lack of efficient acceptance be
Sector Rotation With Sector Relative Strength [Afnan]Most traders spend their time reading charts, drawing levels, waiting for breakouts, and searching for the perfect Demand Zone pattern. But very few ask the most important question:
“Is the sector supporting my trade?”
That single question often separates strong moves from failed setups. A breakout inside a weak sector usually fades. A demand zone inside an underperforming group often breaks. But a stock backed by a strong sector? Even a simple pattern can turn into a powerful trending move.
OBV + MACD Confirmed FVG📉 Bitcoin – Bearish FVG Retracement With EMA200, OBV & MACD Momentum Confluence
This chart highlights a clean bearish structure on BTC, defined by a consistent sequence of Lower Highs (LH) and Lower Lows (LL). Throughout this downtrend, multiple Fair Value Gaps (FVGs) have formed — each created by sharp institutional displacement that leaves behind inefficiencies in price.
As price continues trending below the EMA200, bearish order flow remains firmly intact. Each time BTC retraces into an un
US500 – Liquidity Sweep at the Highs With Bearish Continuation PPrice has swept the immediate buy-side liquidity sitting above the recent high and is already showing signs of exhaustion. The reaction suggests a possible distribution phase forming near the top, aligning with the broader HTF narrative for a corrective leg.
If price fails to reclaim the swept high, the next logical target becomes the sell-side liquidity resting at the lower blue line.
Bearish Path:
• Sweep of the highs
• Failure to sustain above the level
• LTF shift into bearish structure
•
EURUSD – Retesting Demand Zone for Potential Upside ReversalPrice has tapped into a well-defined HTF demand zone after a controlled selloff. The latest wick into the zone suggests absorption and potential willingness to push higher.
If the zone continues to hold, I’m expecting bullish orderflow to kick in, leading to a structure shift and an upward continuation toward the next liquidity pool.
Bullish Path:
• Sweep into HTF demand
• Hold above the blue line (micro support)
• Shift in structure
• Continuation toward upside inefficiencies
⚠️ ENTRY CONDIT
Part 7 Trading Master Class Why Traders Use Options
Hedging – Protect portfolio against price swings.
Speculation – Bet on future price movements with smaller capital.
Income Generation – Sell options and earn premiums.
Arbitrage – Exploit mispricing between spot and derivatives.
Options Pricing Models
Two main models:
Black-Scholes Model: Uses volatility, strike, expiry, and interest rates to price options.
Binomial Model: Breaks time into steps, considering probability of price moves.
Factors affecting option pr
[AI] Advanced MTF Dashboard Pro █ 9 Timeframes + Signals# 🚀 Advanced MTF Dashboard Pro █ 9 Timeframes + Signals
## The Ultimate Multi-Timeframe Analysis Dashboard - See Everything at a Glance!
Transform your trading with the most comprehensive MTF dashboard on TradingView. This professional-grade tool analyzes 9 timeframes simultaneously, giving you instant market insights that would normally require multiple charts and hours of analysis.
---
## ⚡ KEY FEATURES
### 📊 **9-Timeframe Analysis**
✅ **Complete Coverage** - 1m, 5m, 15m, 30m, 1H, 4H, D
Smallcap 100: No trades yetNIFTY SMALLCAP
➡️My customised indicator telling me to wait. This is one of the tools I use to decide the market breadth.
➡️When the index is above the channel, the chances of getting trades right and extremely rewarding are higher.
➡️Below it, it’s not the most conducive trading environment especially in smallcap.
➡️Not jumping onto new positional trades as of now.
Negative divergence for S&P 500 and No of stocks >50dmaThe breadth measured based on the number of stocks above or below the 50dma can be a good sentiment indicator. Weakness shows lower market participation at new highs and should set it up for a correction. Diffusion indicators like this are sometimes useful, especially while gauging the short-term trend.
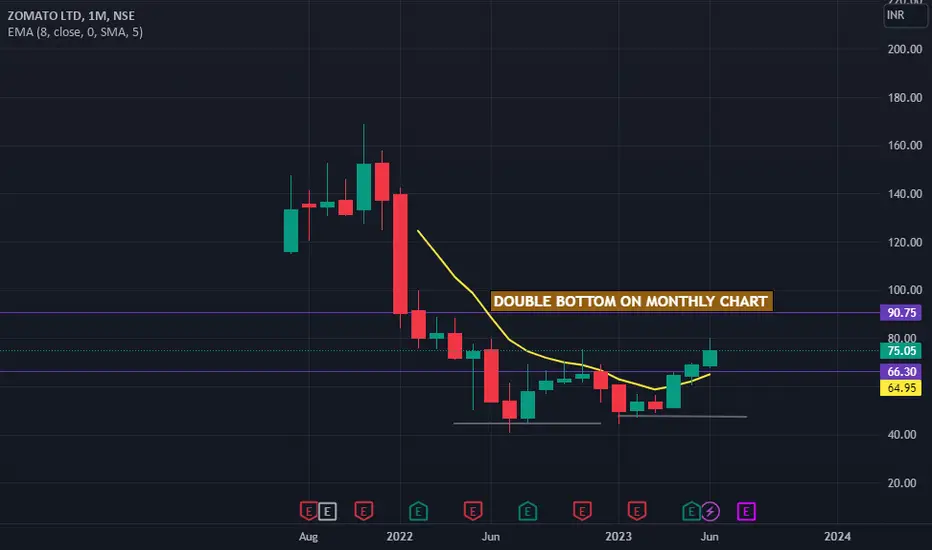
ZOMATO DUAL BOTTOM ON HIGHER FRAME The counter formed a dual bottom on month frame
the dual bottom in major food delivery giant suggest bad days a thing of the past
lets see what's in store
ZLong
today Pro Scalper indictor caught 200 nifty pointwe should combine this indicator with ADX indicator.
example of Sell
SELL signal
VWAP: Price trading below VWAP
Price is trading below Super trend (21,1)
Price is trading below Super trend (14,2)
Price is trading below Super trend (10,3)
ADX -DMI should be above 25
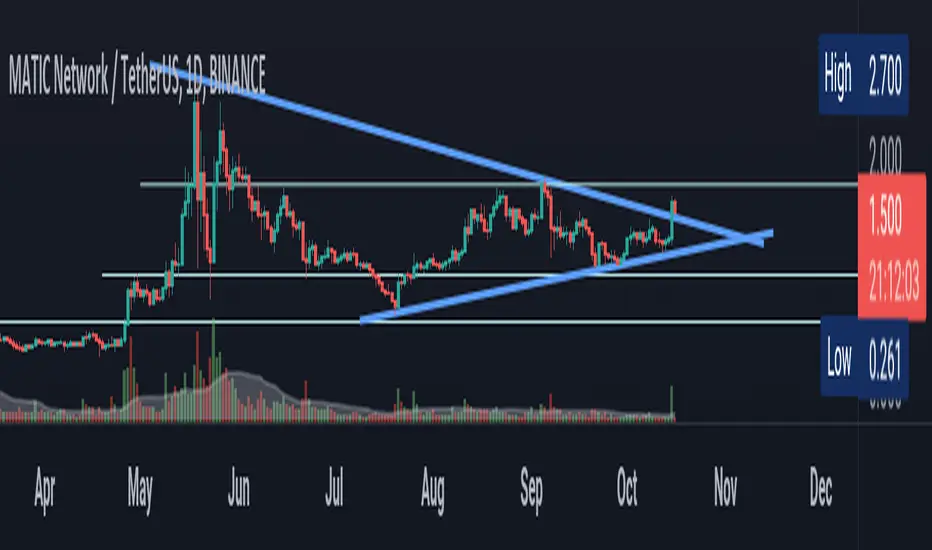
Matic looks bullishMatic had brokeout from the symmetrical triangle pattern yesterday with massive volume and today I guess it consolidates a bit. If it sustains above the trend line today, we may expect a good upside move in this coin in coming days. There were other signals too
1. Closed above the Upper BB,
2. Closed well above the Pivot and may bounce back from the pivot,
So do have an eye on it.
MLong
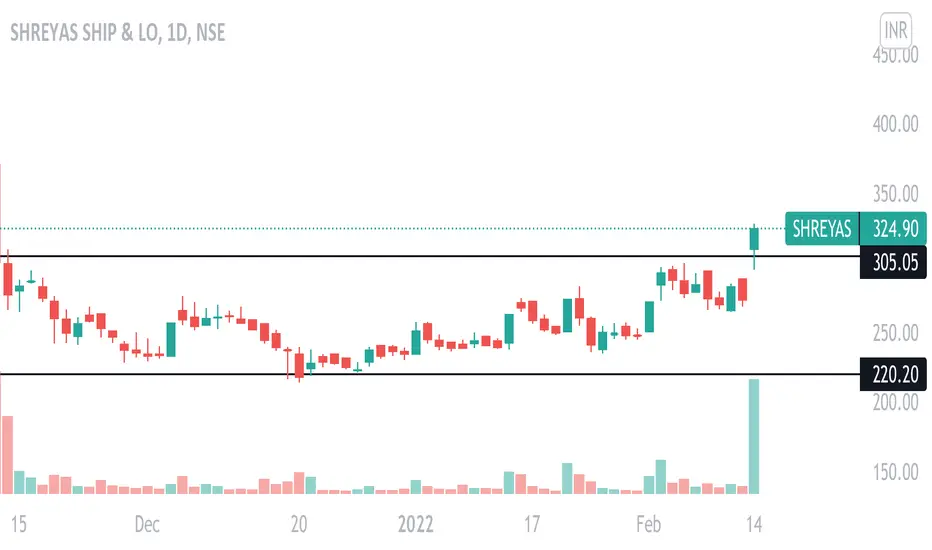
Hold in AMBUJA CEMENTSThis scrip is in an uptrend for a while and it had retested the major resistance after the breakout. Now this is in a downfall after making fresh swing high and i see this a small consolidation. RSI is showing a divergence as well as last 2 days volume rising with fall in price, so i guess the downfall may continue for days to week but key levels according to me where this scrip might reverse is 410 & 392 (Monthly Pivot & Resistance).
Look for buying opportunity when there is a green candle wit