Bullish Patterns
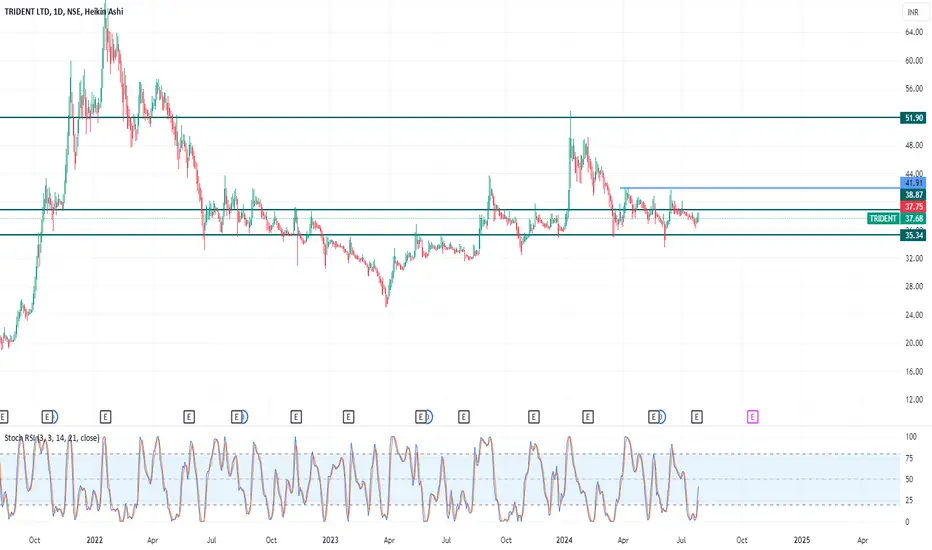
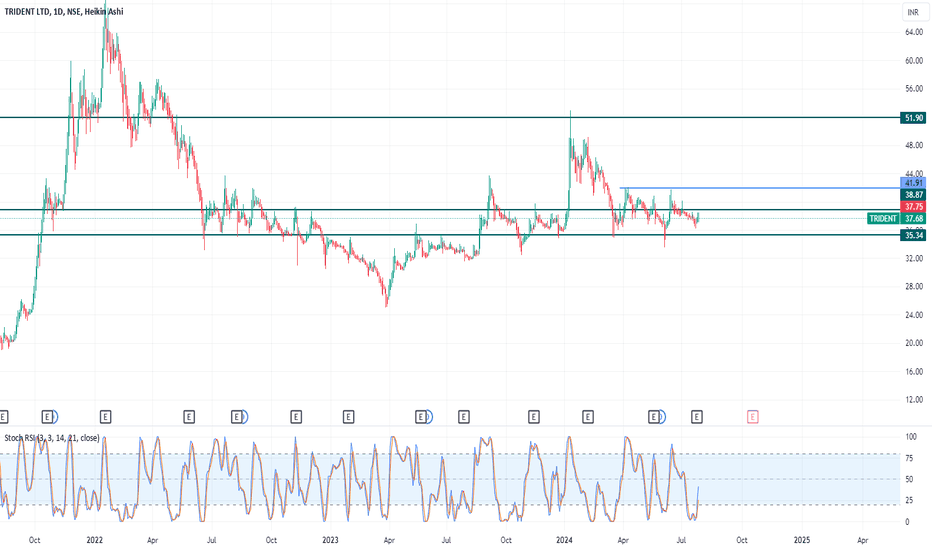
Trident 37.75 - Profit Making opportunity (30% to 50%) or moretrident has been consolidating for while and it was in sideway trend.
by looking at volumes and deliverable quantities stock is expected to move upside.
it shows buyer's are interested to buy this stock and its shows strong buy signal.
1. if stock breaks 42 we might see it move up to Rs 51
2. Best buy around 37 to 38 stoploss 35.50
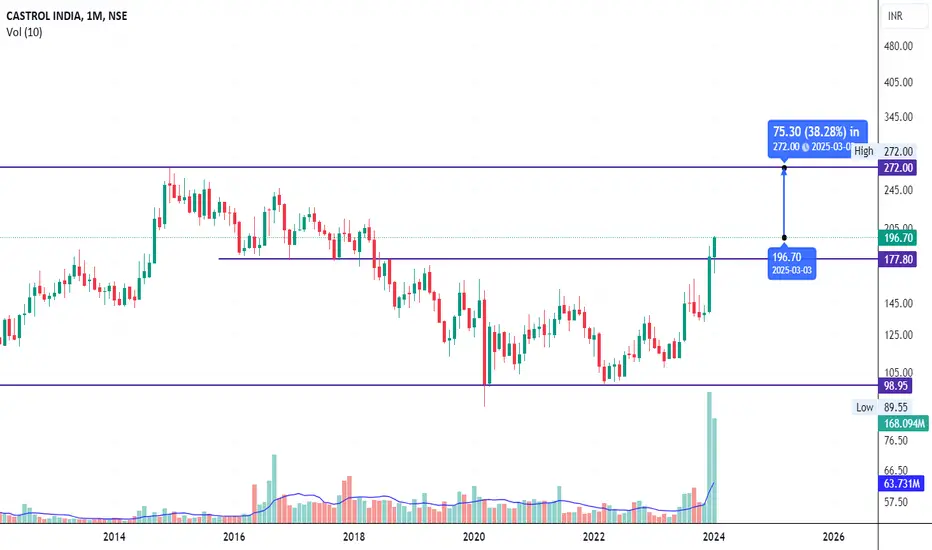
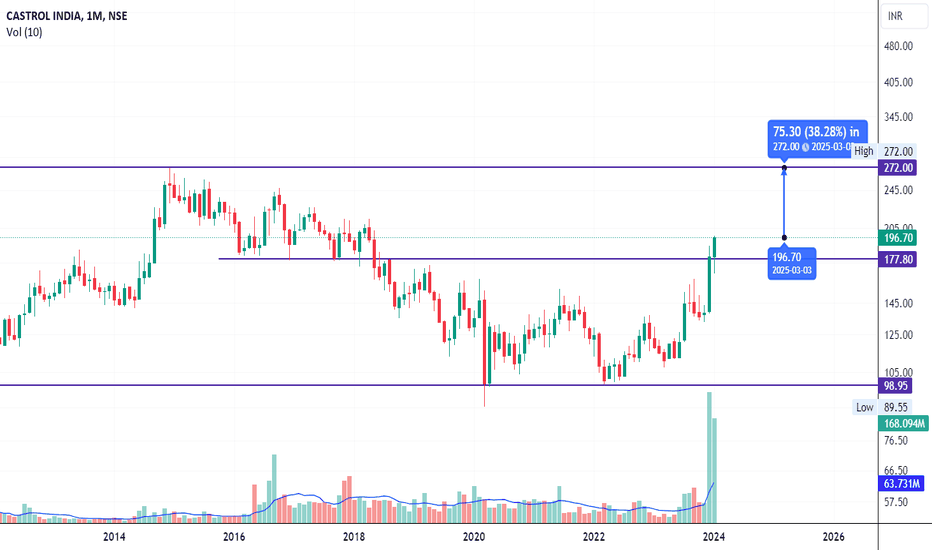
CASTROLIND - 5 years High / consolidation BreakoutCASTROLIND
1) Time Frame - Monthly.
2) The Stock has been consolidating since August, 2018 and has given a breakout with strong bullish momentum & Huge volume.
3) The stock may reach its previous All Time High (272) in long term.
4) Recommendation - Strong Buy
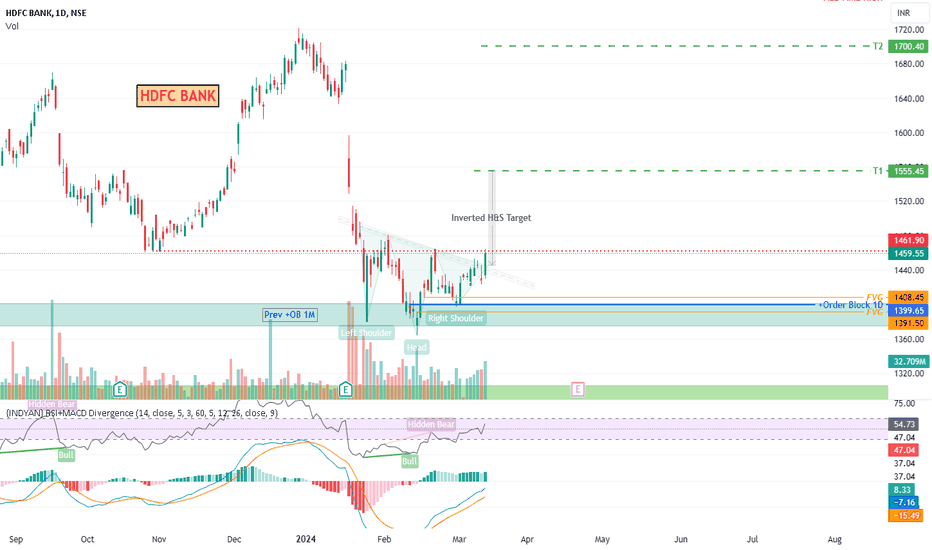
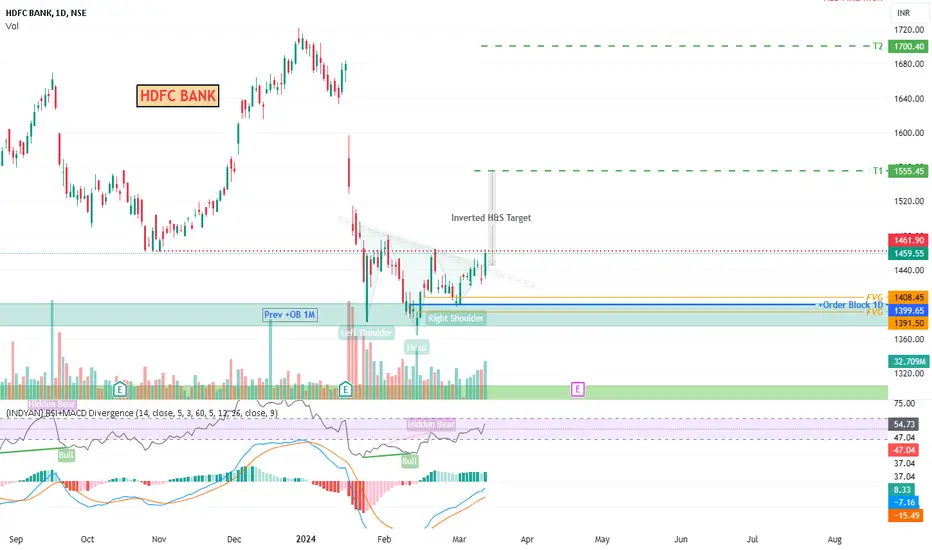
HDFC BANK NSEDATE - 12th March 2024.
HDFC Bank has breakout today with good amount of candle size and volume too.
Applied Concepts
Chart P. - Inverted H&S
Positive Order Block from Daily Time Frame and Previous OB of Monthly TF as shown in chart.
Only OB is not a good option so here we have applied FVG (Fair Value Gap) also, Price Action has successfully reversed from FVG and gave confirmation for potential upside movement.
Targets
1st Target as per Chart P. is 1555 Rs.
and Further upside
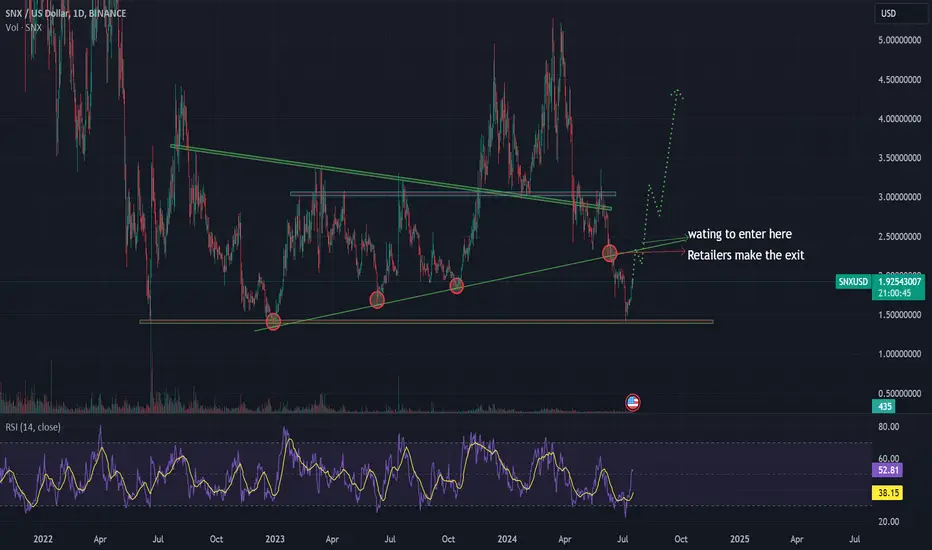
Retailers Exit, Big Money Enters: Time for a Bullish Surge
The chart is looking bullish for several reasons. Firstly, the RSI (Relative Strength Index) is rising quickly, indicating increasing momentum. Secondly, there's a noticeable uptick in volume, which supports the price movement.
The main reason for my bullish outlook is a simple price action pattern I've observed repeatedly. When the price hits a support level 3-4 times, it often indicates a very strong support. Retail investors typically place their stop-loss orders just below this support lin
SLong
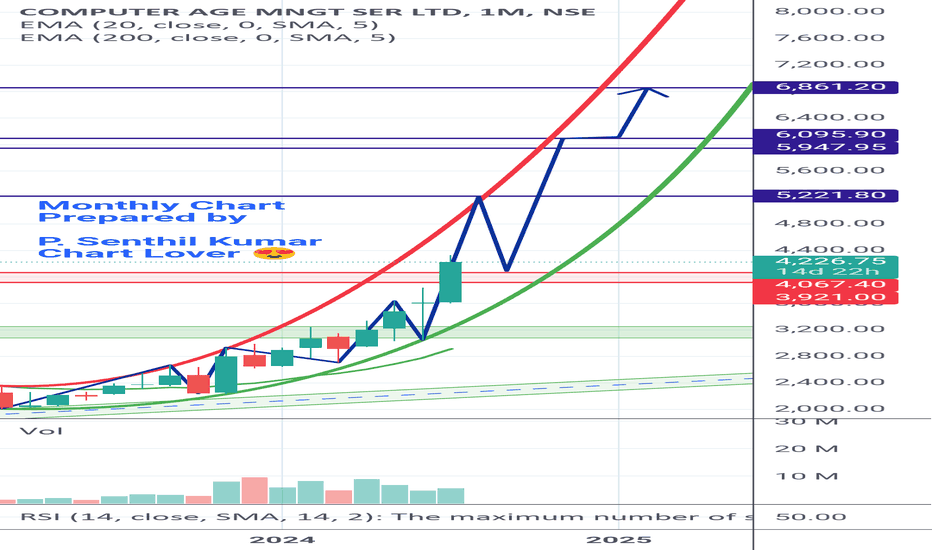
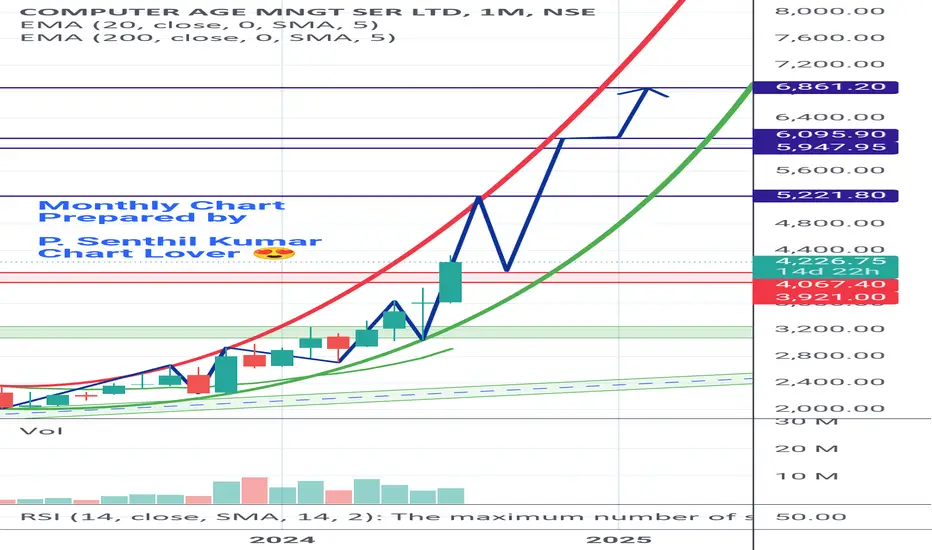
CAMS - Growing Kid. Portfolio Stock CAMS
Looking good in Parabolic uptrend pattern.
Bullish View.
If this Monthly closing is above 4100+,
Then we can expect the following tgts.
1 : 5221±
2 : 5948±
3 : 6096±
4 : 6861±
Shared it for Reference Purpose based on chart pattern and My STUDY.
Do your analysis from your side too
This is not a BUY or SELL RECOMMENDATION from my side.
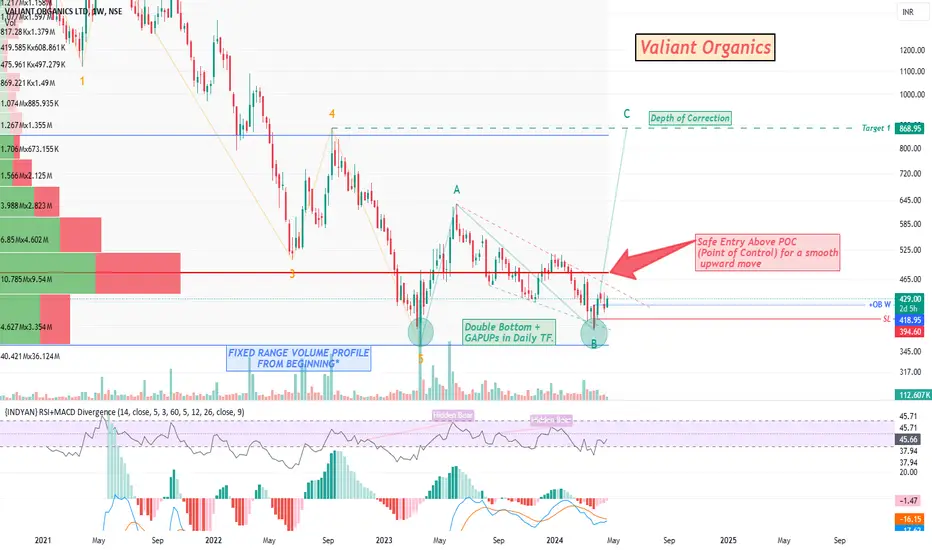
Valiant Organics NSE by KRSChartsDate: 24th April 2024
Time : 10:45 Am
Valiant Organics has been in my watchlist for a long time,
Finally, it seems like its Wave structure of downfall is finished with March low point.
Now in ABC Wave Structure C Wave is likely to reach till Depth of Correction Point which means Prev point of 4th wave is new Target.
Apart from this There is a Double Bottom Chart Pattern is visible too with Bullish Div on Monthly TF with RSI.
More Confirmation had arise when on 1st April its Gap
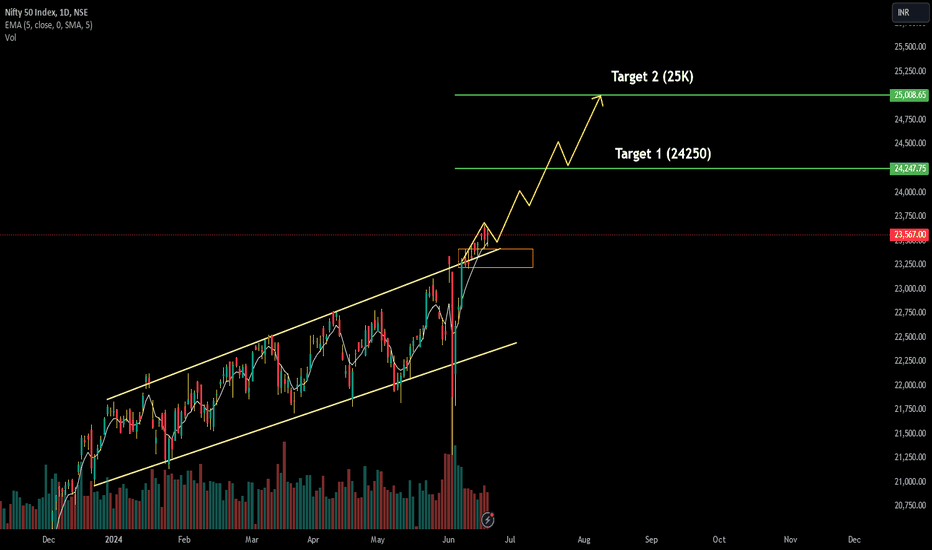
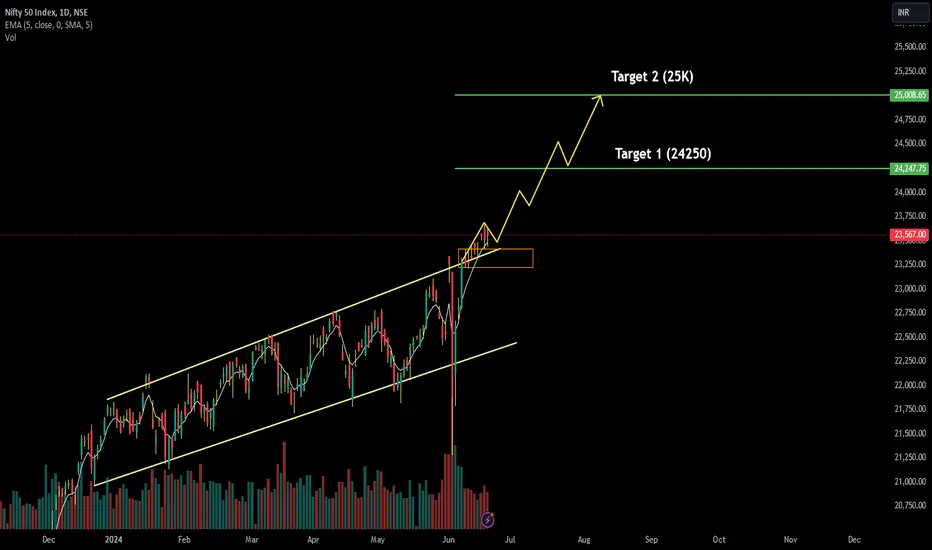
NIFTY 50 is ready for the Take-off.In the given Nifty 50 Daily time frame chart, we can see a parallel channel pattern and it's breaking out the channel and ready to form the new sky.
We can see targets of 24000,24500,24850,25120,25300 in the positional basis.
Get ready for the fly.........
*Disclaimer: Above description is only for the educational purpose, please do not take any kind of BUY or SELL on the basis of same. Please consult with your advisor before investing.
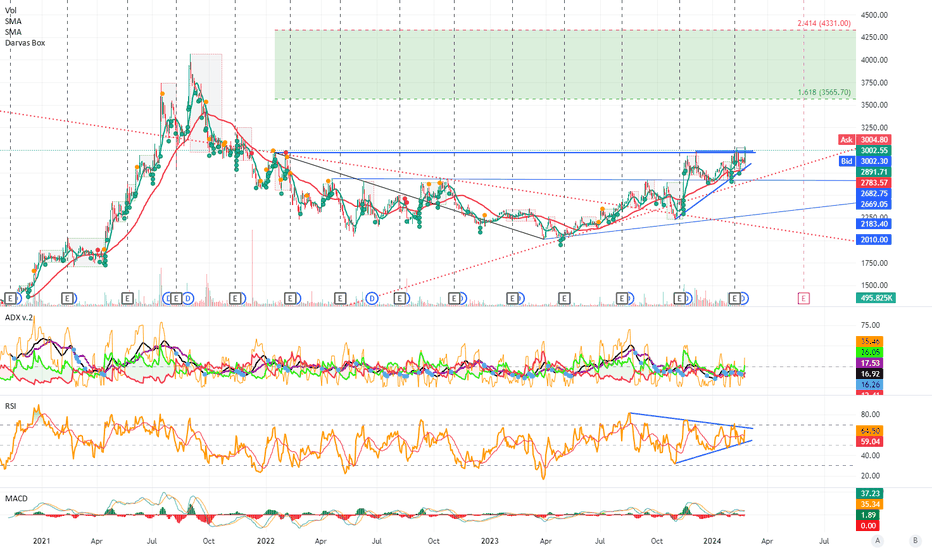
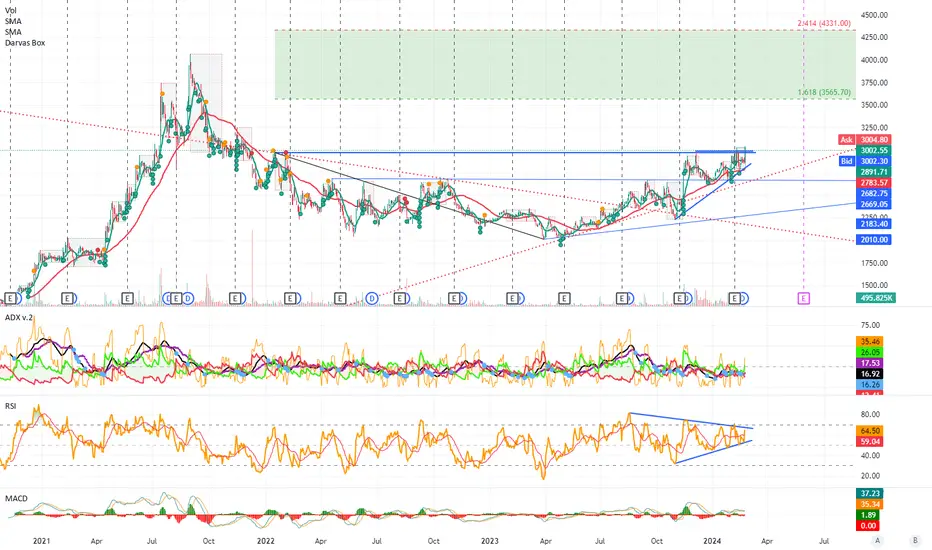
Cams Ltd Ride the Bull (Study Purpose)Ride the Bull Cams Ltd, trading above major resistances of Rs2971-3025, sustaining above these levels shall make it travel towards fib ext 1.618 levels and previous highs.
Promoters has exited completely in December 2023, new investors like Fii and Dii have lapped up this company.
Rsi in Daily/Weekly/Monthly are near 64/68/64
Adx showing strength in the momentum
SL Rs2900
Disclaimer : Above scenario just for educational purpose and study of graphical movements as per available technical paramet
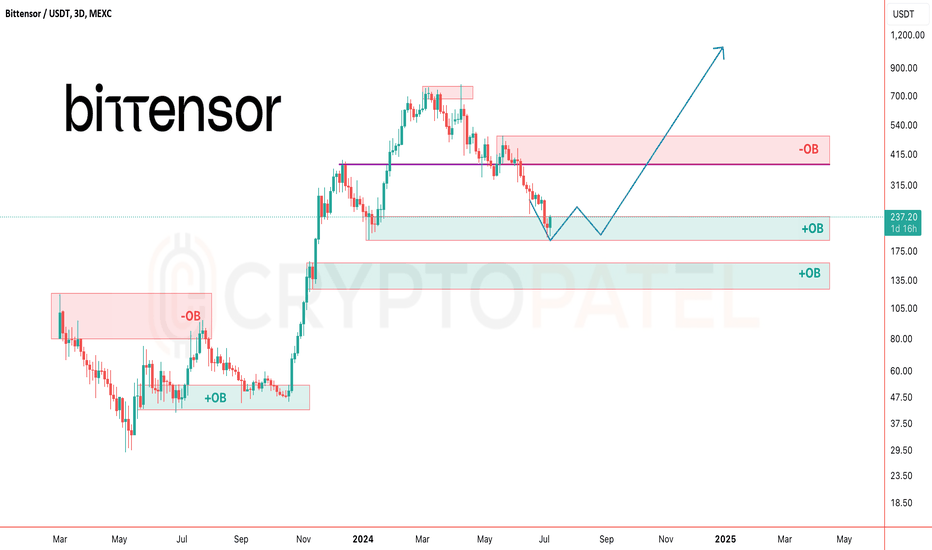
TAO/USDT Ready to fly toward $1000 ?TAO/USDT Chart Analysis
GETTEX:TAO is 68% down from ATH in 3 months but up 750% in a year, giving 26x returns from the bottom!
- May 7, 2023: $29
- Current: $236
- ATH: $777
Analysis:
- Bounced from bullish OB1, targeting $350-$400.
- Breaking the red box bearish OB could lead to $1000.
- Falling below $200 support may drop to OB2 ($130-$150) – best entry zone.
#Altcoins #bittensor
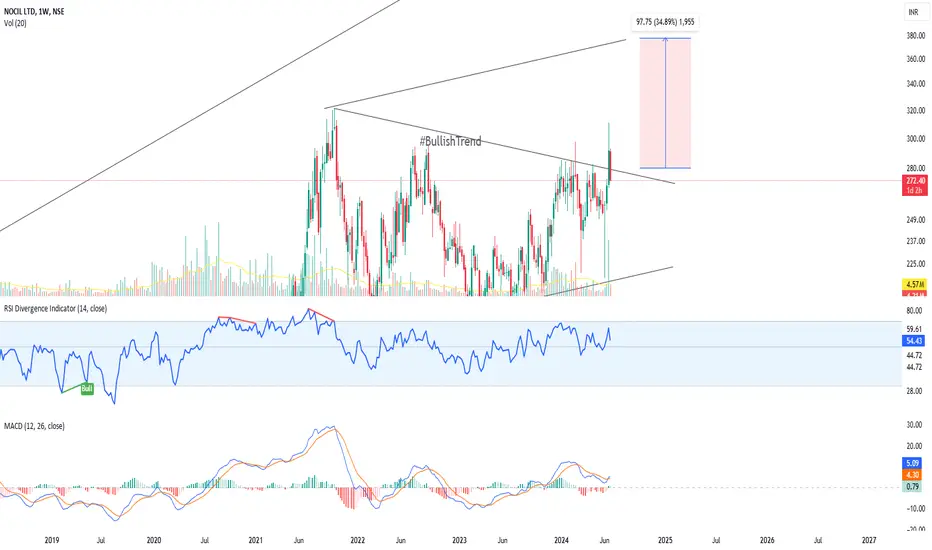
Breakout in NOCIL1. **Price Movement**:
- The price has been in an uptrend since mid-2020.
- There was a consolidation phase that lasted from mid-2021 to mid-2023, forming a symmetrical triangle or a range-bound pattern.
- Recently, the price has broken out of this consolidation pattern to the upside, which is a bullish signal.
2. **Volume**:
- The volume spikes suggest significant trading activity during certain periods.
- A noticeable increase in volume during the recent breakout, supporting th
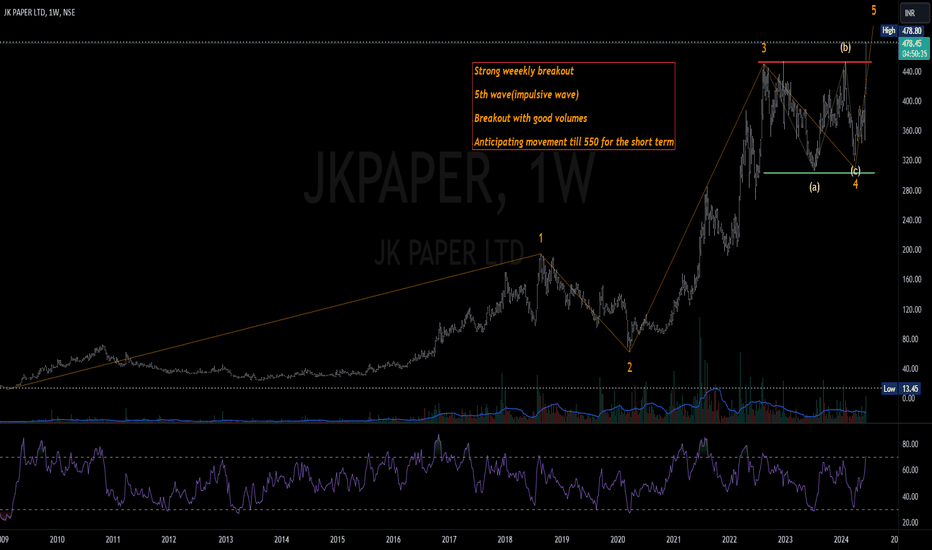
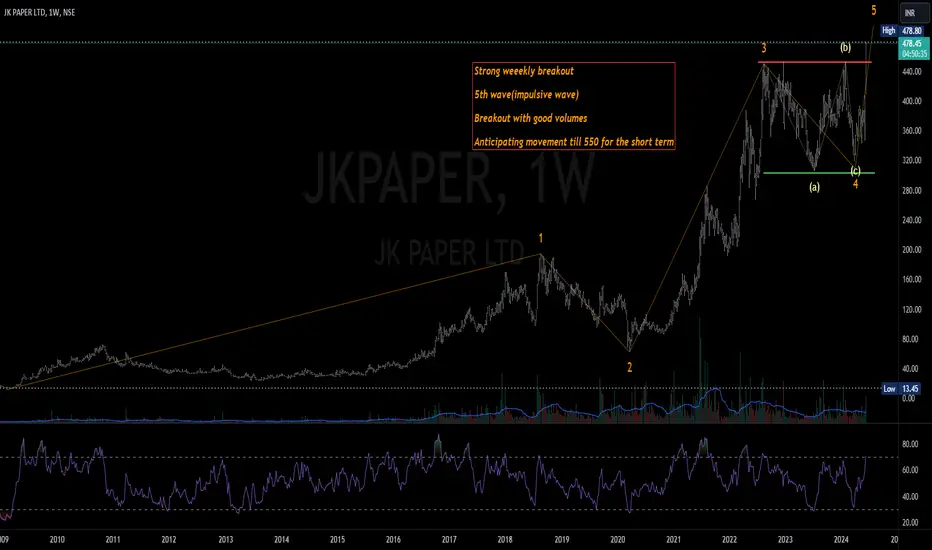
JK PAPERI'm not a SEBI registered analyst, Views are personal, not any buy or sell recommendations.
Today I discovered JKPAPER, which has experienced a breakout in the Weekly chart. Additionally, I noticed that it is currently in its 5th wave, which is an impulse wave. Considering the wave structure and the strong performance of consumption-based stocks , I predict a short-term upward movement in the stock. Please refer to the chart for a detailed analysis.
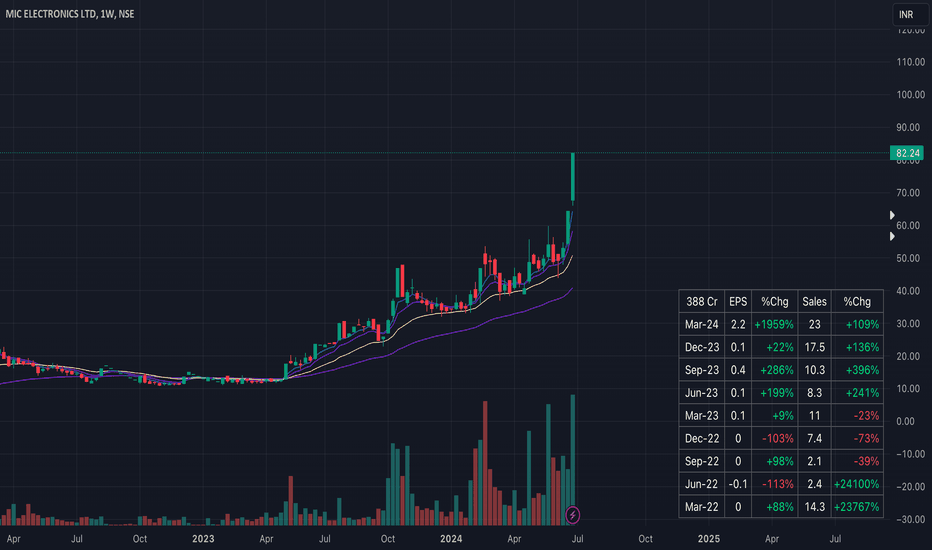
Channel Breakout Strategy for Long-Term AccumulationLet's structure it as a clear trading strategy:
**Trading Strategy: Channel Breakout and Long-Term Accumulation**
1. **Identify Breakout**: Look for stocks breaking out of their historical trading range, accompanied by a sudden increase in trading volume.
2. **RSI Confirmation**: Confirm the breakout with the Relative Strength Index (RSI) around 53, indicating moderate bullish momentum without being overbought.
3. **EMA Analysis**: Ensure the stock is trading above all key Exponential Mov
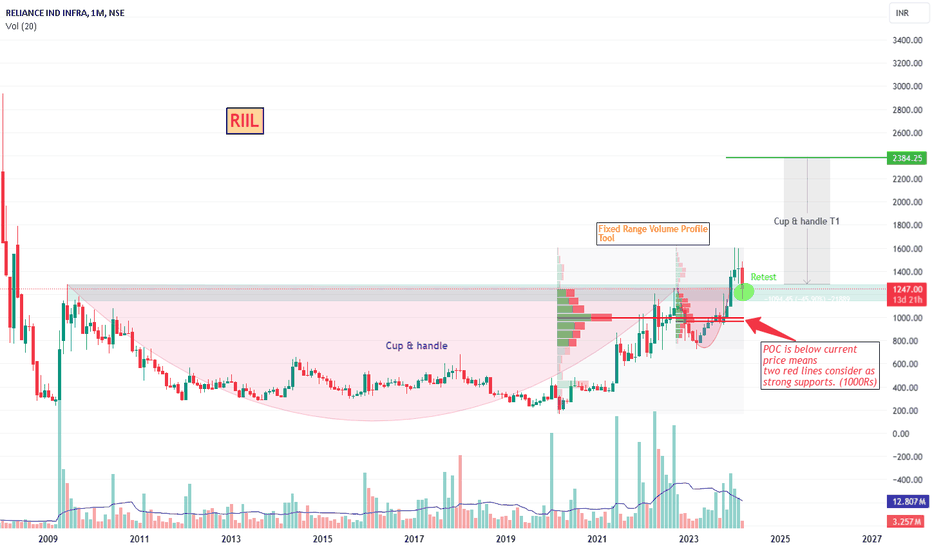
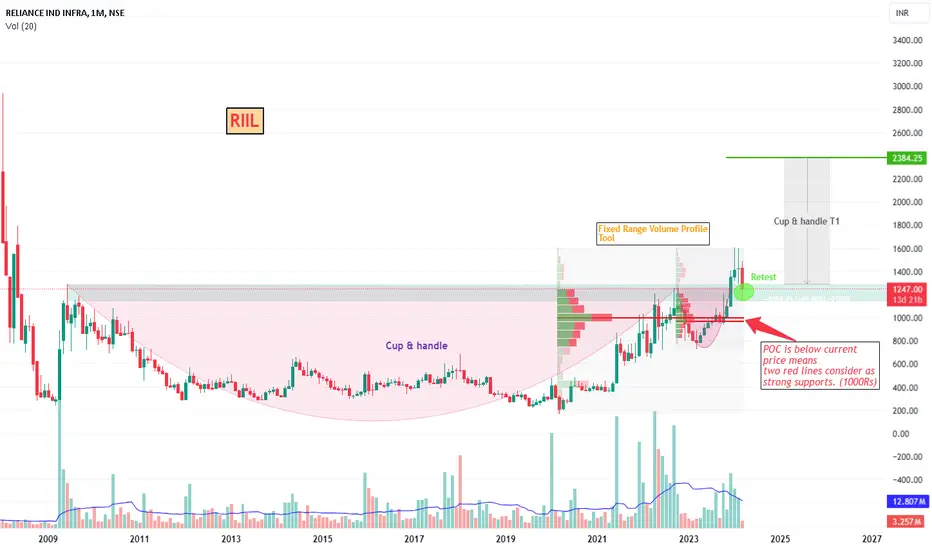
Reliance IND Infra Ltd. (Cup & Handle)Date- 14th March 2024
Time - 18:41
-As we can see RIIL has formed Cup& Handle Chart Pattern and also trying to retest today on daily basis.
-One more thing I have noticed and applied here is Fixed Range Volume Profile Tool , to identify where exactly the most volume has created. Which was 1000 Rs. in this case.
-If Current price is above POC (Point of Control) red line means, next big supports are near that price. So, if its breakdown from retest point it can go till 1000 Rs or if it r
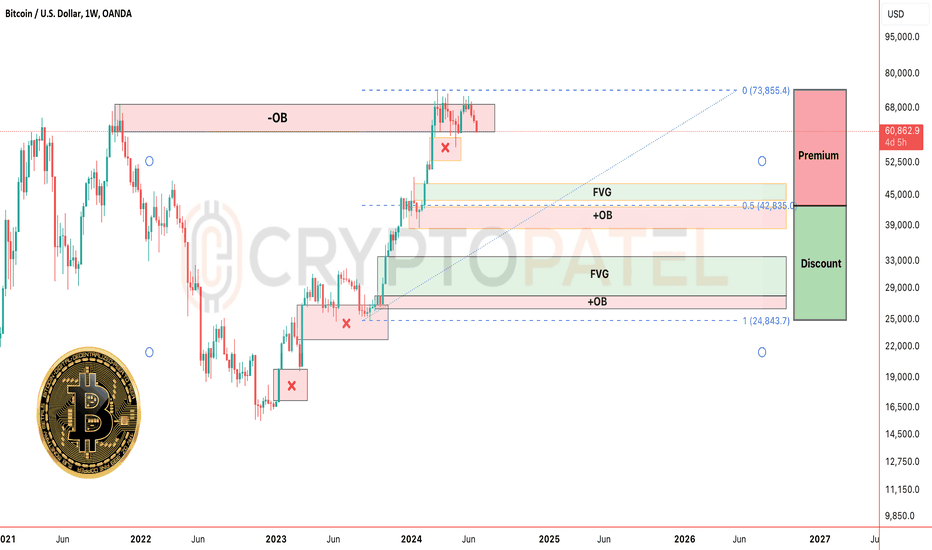
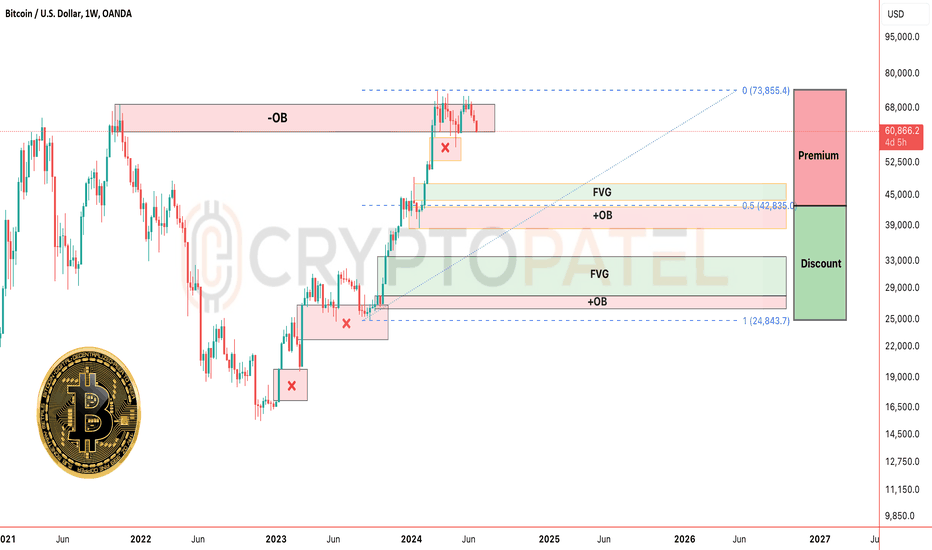
Bitcoin Ready For $28,000 As per SMC Chart AnalysisBITCOIN Urgent Weekly Chart Update
Weekly Chart Analysis:
Order Block (OB) 1: $42,000 - $38,000
First Fair Value Gap (FVG): $47,557
Order Block (OB) 2: $28,000 - $26,400
Second FVG: $33,802
Potential Scenarios:
We could see a fill of the first OB and FVG before a new upward rally.
Both FVG and OB are in the discount zone, increasing the likelihood of hitting the second OB and FVG around $33,000 - $30,000.
Spot Entry Levels:
Entry 1: $47,600 - $41,600
Entry 2: $33,900 - $27,000
Targets: $100,
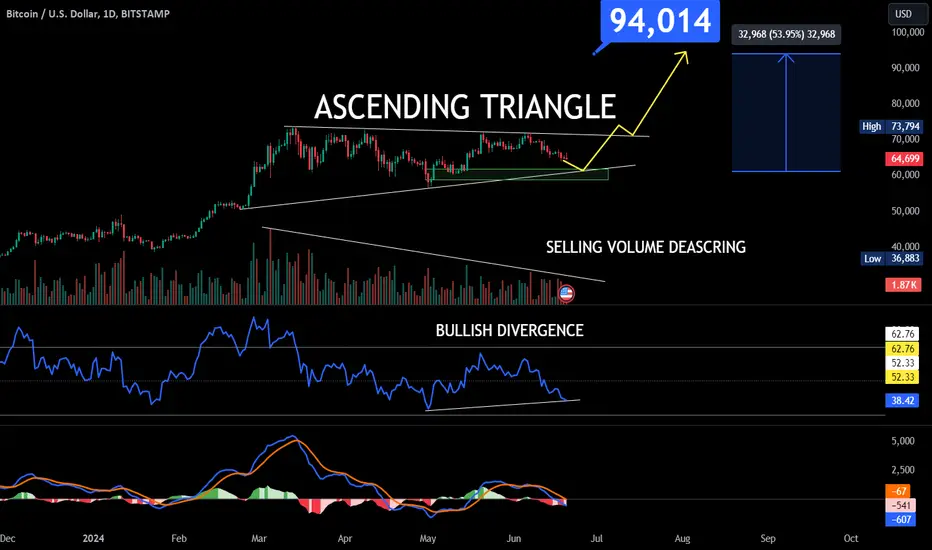
Bitcoin Poised for $94K: High Bullish Momentum AheadBitcoin is currently forming an ascending pattern, signaling a potential bullish market. Additionally, the RSI has formed a bullish divergence, and the decreasing selling volume supports this outlook. If the breakout occurs successfully, we could see Bitcoin reach $94,000.
#Bitcoin #Crypto #BullMarket #BTC #RSI #CryptoTrading #TechnicalAnalysis #CryptoBullRun
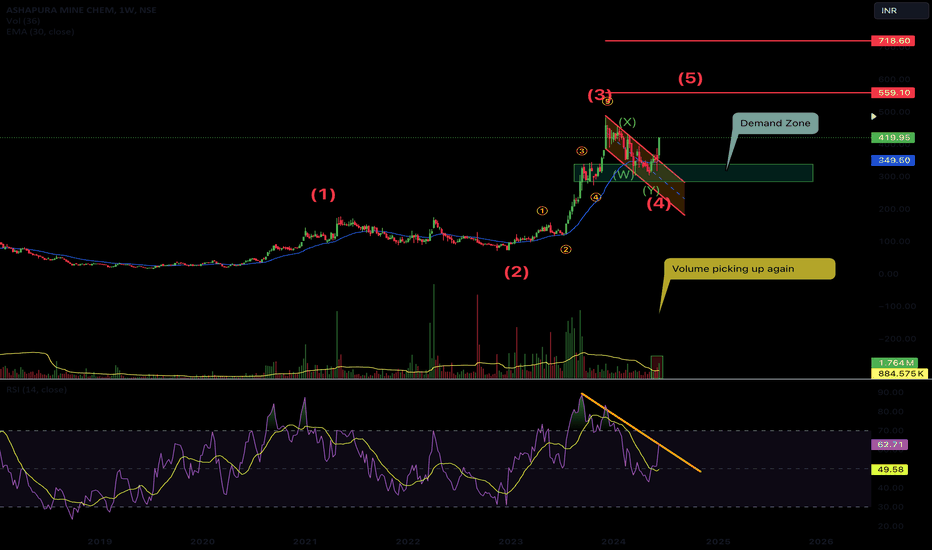
ASHAPURA MINECHEM - NEW IMPULSE - BULLISHHi Folks,
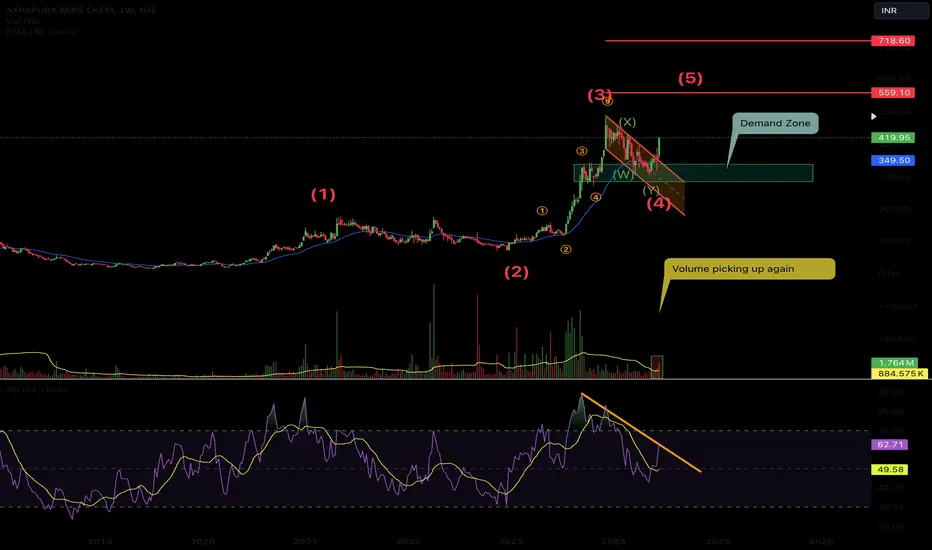
Stock has seen a major breakout on weekly charts from falling wedge pattern. RSI has broken out to confirm the upmove. Closing above 30 WEMA also provide more indications at the change of trend for coming months.
Elliott Wave Analysis
1. Completed an ongoing impulse with a divergent 3-5 wave.
2. Correction of the impulse seems to be completed wherein RSI cooled off.
3. Outbreak in RSI, price and volume support indicates towards shift of trend.
4. Halt weekly candle or a follow up
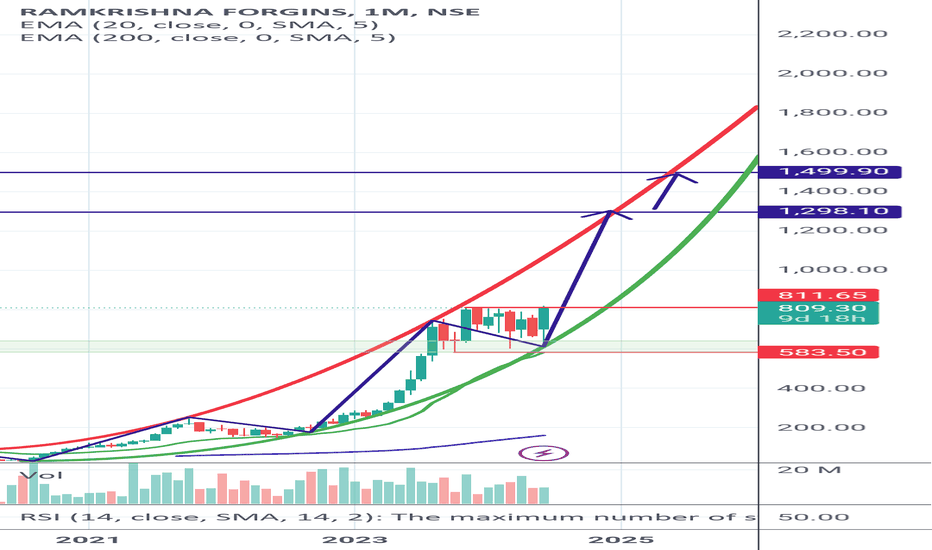
Rk forging (going to be RocKing Forge) RK forge going to be RocKing forge
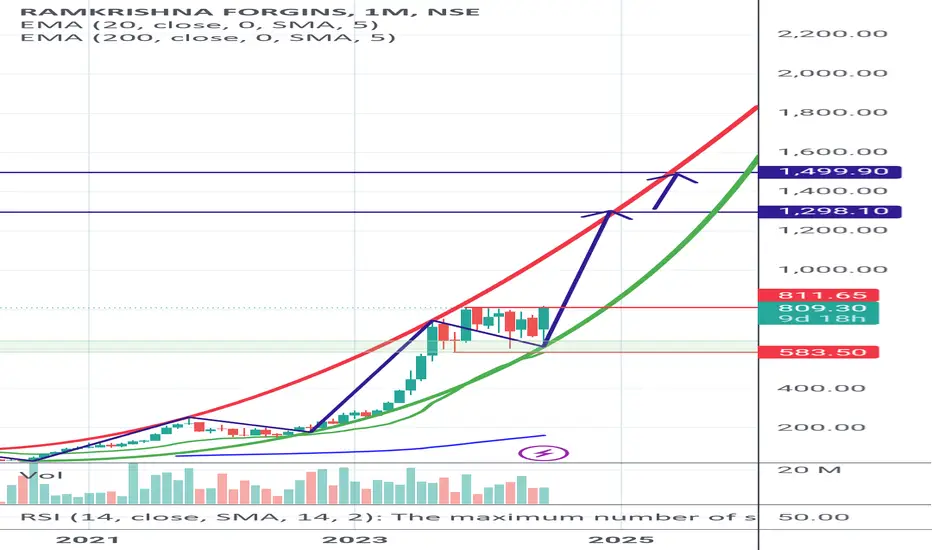
Looks good in Parabolic uptrend pattern.
Time Frame Monthly.
On closing above 813+ in monthly chart makes it more bullish and can rally to
Tgt 1 : 1298±
Tgt 2 : 1500±
Shared it for EDUCATIONAL purpose based on chart pattern and My STUDY.
Do your analysis from your side too.
This is not a BUY or SELL RECOMMENDATION from my side.