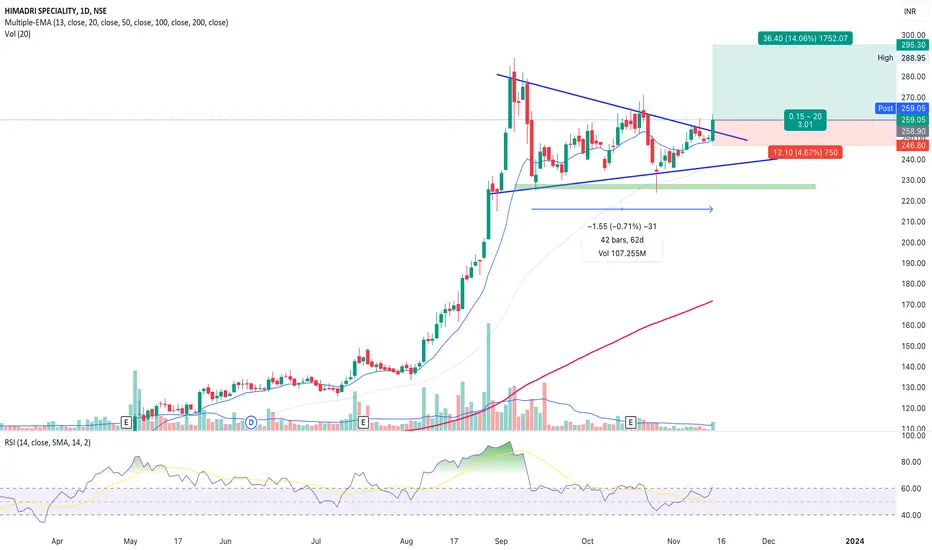
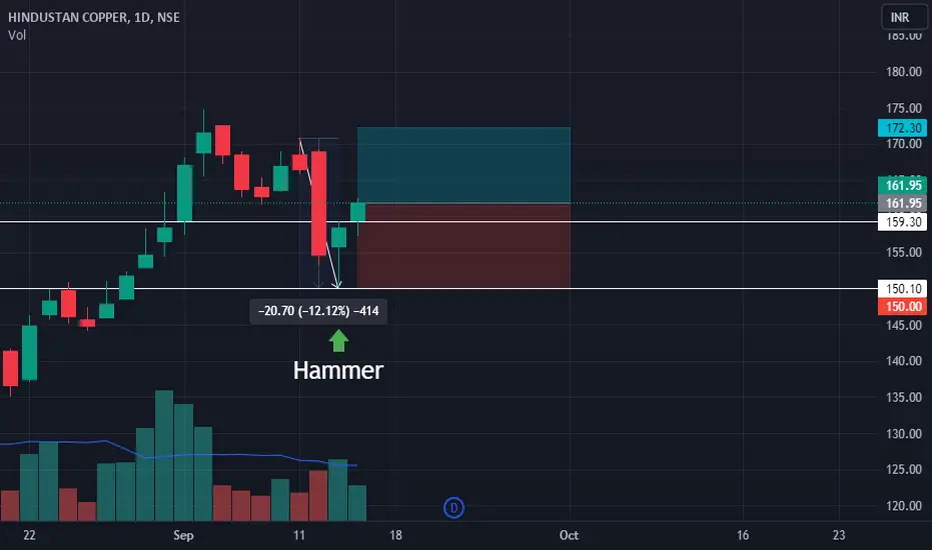
HSCL Bullish Breakout analysis 13 NovHSCL is a process industry. By looking at the chart data, it has given a confirmed breakout. After a nice bullish move, it has been consolidating for the past two months. It now again has given the breakout of the descending triangle pattern, which is a continuation pattern.
HSCL might be making a nice, bullish move.
Reason:
Price > EMA(13,50,200) seems continuation of the trend..
RSI > 50 crossing 60, means bullish trend.
Price > Vwap (just Near the VWAP to upside)
Descending tria
Bullish Patterns
EASEMYTRIP Daily looking bullishEASEMYTRIP looking bullish. It has trendline breakout with 200 ema support on daily candle.
************************************
This is purely for training and educational purposes. We shall not be responsible for your profit or loss.
The stocks discussed or recommended here, may not be suitable for all investors. Investors must make their own investment decisions based on their specific investment objectives and financial position.
Analysis: Nasdaq 100 Bullish Flag Breakout TradeAnalysis: Nasdaq 100 Bullish Flag Breakout Trade
Based on the bullish flag pattern breakout in Nasdaq 100 and your expectation of more buyers entering the market, i have identified a trade opportunity. With a buy entry at 15129.7, a stop loss at 14626.0, and a take profit at 16694.7, i have defined your risk and reward targets. Here is a breakdown of the analysis for this trade setup:
Index: Nasdaq 100 (Ustec100)
Entry Price: 15129.7
Stop Loss (SL): 14626.0
Take Profit (TP): 16694.7
Bullish F
Bank Nifty Simple Analysis- Looks like buyers are coming in bulls above 43300 - 43350
- As per trend it shows downward move has been denied by buyers and todays gap up opening comirms buyers trying to pull back up.
- May be a gap up opening can be there which may triggers buyers
- Sellers below 42800 till 42600 but beware of traps here
- Support also at 42600 and resistance at 43230
Note : Do your own analysis before making in trade or invesments
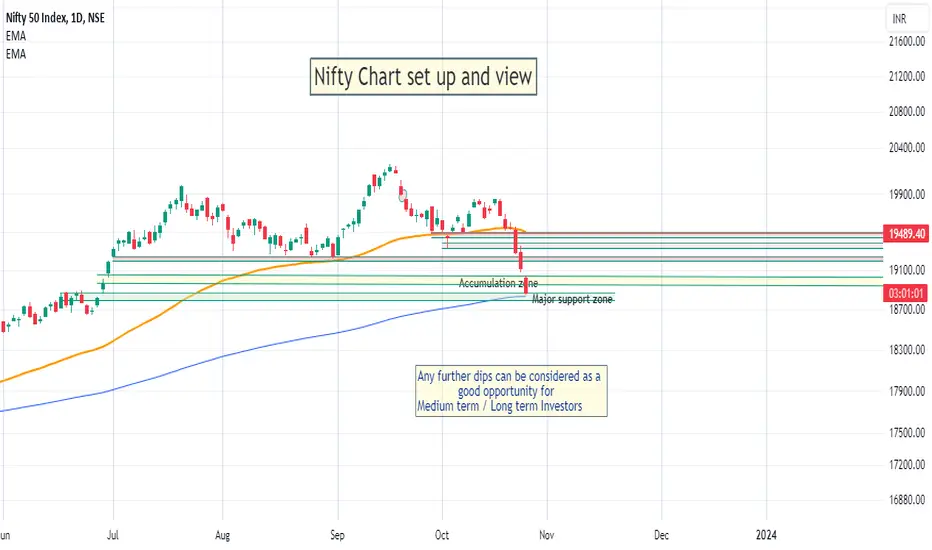
Nifty @200 day EMAWe have highlighted this possibility few days back that below 63 day EMA Nifty might have a strong probability of touching 200 day EMA...
Here we are Nifty lingering around 200 day EMA.
Closing Short positions should be considered.
For Medium to Long term investors, these are good times to accumulate good quality stocks in Equity / Cash
Take care & safe trading...!!!
Gold buyers approach $1,990 resistance amid overbought RSIGold Price rises to the highest level in three months on early Friday, rising for the fourth consecutive day, amid a softer US Dollar and mixed sentiment. That said, the Greenback dropped heavily on Thursday after Fed Chair Jerome Powell signaled no rate change in the short term. It’s worth noting that the XAUUSD’s successful break of the 200-day SMA and previous resistance line stretched from May added strength to the bullion’s run-up earlier in the week. With this, the precious metal is all se
This PSUBank stock is looking strongFundamental analysis:-
Bank of Maharashtra is a PSUBank stock which can give good returns in short as well as long term.
The stock has a good dividend yield and is available at a cheap price as per PE and PB ratios.
Technical analysis:-
The stock has given a breakout from Inverted head and shoulder pattern. A closing above 32.45 can provide more than 10% returns.
Entire PSU bank sector is currently bullish.
Note:-Idea is shared for educational purposes and should not be taken as a recommend
Alok Ind: Chart set up, imp Entry levels and Potential targetImportant Levels are mentioned in the chart itself.
Plan to put money in staggered manner.
Target 28 / 32
SL 14 on weekly closing basis
Plan your trade accordingly....!!!
Take care & safe trading..>!!!!
Like and Follow
Disclaimer
-The view expressed here is my personal view
- Past performance is not a guarantee for future predictions
- I have been wrong in the past and can be wrong again in future too
- Use this for educational purpose
- Any decision you take, you need to take respons
GOKUL Daily looking bullishGOKUL daily looking bullish, it has trendline breakout/flag and pole breakout.
Good for positional..
*********************************
This is purely for training and educational purposes. We shall not be responsible for your profit or loss.
The stocks discussed or recommended here, may not be suitable for all investors. Investors must make their own investment decisions based on their specific investment objectives and financial position.
EQUITASBNK - Continuation Wedge (Bullish)Daily chart analysis of EQUITASBNK tells me that following a brief pause, the previous upward trend is poised to resume.
A Bullish Continuation Wedge illustrates a momentary pause in an ongoing upward trend, characterized by two converging trendlines that both slope downward against the prevailing trend. Throughout this phase, there's a struggle between bearish and bullish forces, with bears attempting to gain control over bulls. Eventually, the bulls emerge victorious, as evidenced by a de
SHANTI Only Daily looking bullishSHANTI Daily has trendline breakout/inverted head and shoulder breakout with 200 ema support on daily candle.
SHANTI looks strong on daily..
*********************************************
This is purely for training and educational purposes. We shall not be responsible for your profit or loss.
The stocks discussed or recommended here, may not be suitable for all investors. Investors must make their own investment decisions based on their specific investment objectives and financial position.
COLPAL for Swing TradeCOLPAL is almost debt free and its net income is also very good. So, fundamentally this stock is very good and technically it is forming an uptrend pattern and it has also gicen a breakout after giving a pullback. So, overall it's a very good stock to consider. Do your own research before investing...